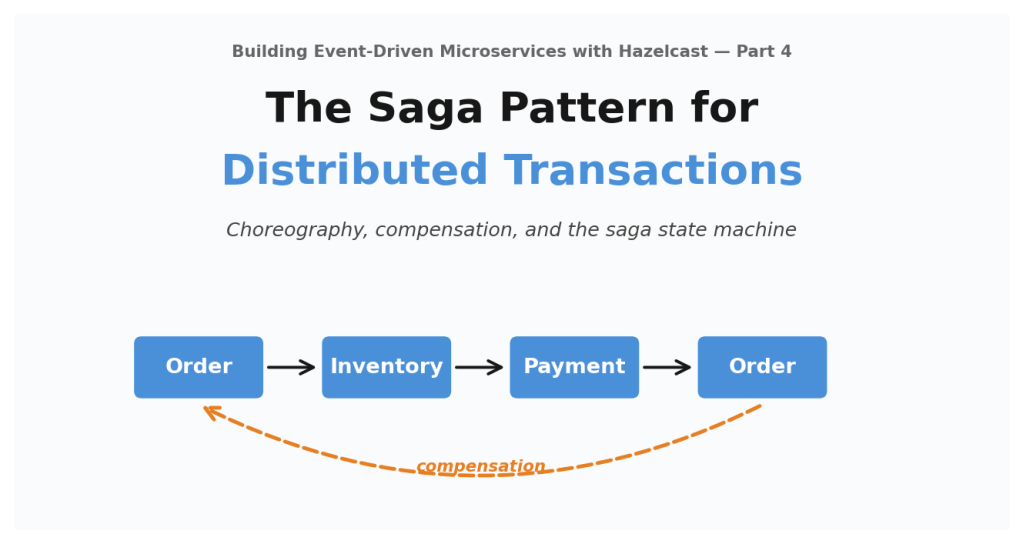
Part 10 in the “Building Event-Driven Microservices with Hazelcast” series
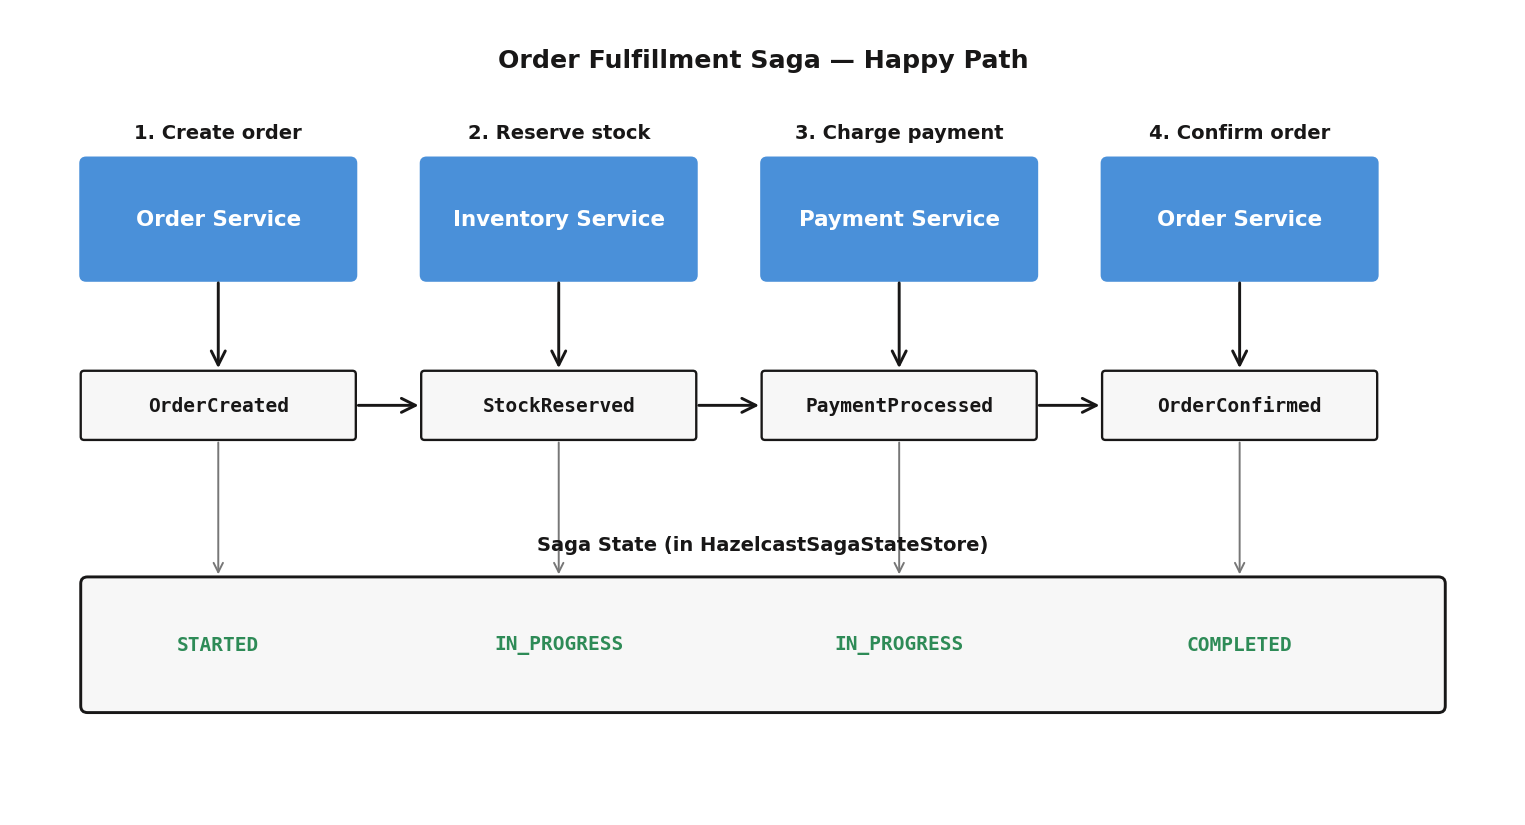
Back in Part 4, we built a choreographed saga for order fulfillment. Four services — Order, Inventory, Payment, and Account — coordinate through Hazelcast ITopic events. Each service reacts independently, no central coordinator. The flow is implicit, spread across three saga listeners, a compensation registry, and a timeout detector.
That works. It works well, actually, for loosely coupled flows where services don’t need to know about each other. But I kept running into the same questions: what if you need the whole saga visible in one place? What if you need per-step timeout and retry? What if the caller wants to wait for the saga to finish before responding?
So the framework now supports a second saga architectural pattern — the orchestrated saga. This post compares both, walks through the implementation, and shows how they run side by side in the same system.
When to Use Which
Neither pattern wins across the board. It depends on what you need:
| Requirement | Choreography | Orchestration |
|---|---|---|
| Services should be fully decoupled | Best | |
| Need the whole flow in one readable file | Best | |
| Caller needs a synchronous response | Best | |
| High throughput (thousands of sagas/sec) | Best | |
| Per-step timeout and retry | Best | |
| Services evolve independently | Best | |
| Complex branching or conditional logic | Best | |
| No single point of failure | Best |
Choreography is the better fit when services publish events for many consumers, not just one saga. Adding a new saga consumer doesn’t require changing any existing service — you just stand up a new listener.
Orchestration is the better fit when the saga is a well-defined workflow with a clear owner and the caller (a REST endpoint, typically) wants to return the result directly. Order fulfillment is a textbook example.
Architecture Comparison
Choreographed Flow

Every arrow is an asynchronous event on the shared Hazelcast cluster. The caller gets back a 202 Accepted immediately. The saga completes whenever it completes.
Orchestrated Flow

Every arrow is a synchronous HTTP call. The orchestrator waits for each step to finish before moving to the next. The caller gets the final result — success or failure — in the response.
The visual difference tells you most of what you need to know. Choreography is a chain. Orchestration is a hub with spokes.
Implementation Comparison
Choreography: Saga Listeners
In the choreographed pattern, each service has a listener subscribed to events on the shared Hazelcast cluster:
@Component
public class InventorySagaListener {

    public InventorySagaListener(
            @Qualifier("hazelcastClient") HazelcastInstance hazelcast,
            InventoryService inventoryService,
            SagaStateStore sagaStateStore) {

        ITopic<GenericRecord> topic = hazelcast.getTopic("OrderCreated");
        topic.addMessageListener(message -> {
            GenericRecord event = message.getMessageObject();
            String sagaId = event.getString("sagaId");

            // Guard: only process OrderFulfillment sagas
            if (!"OrderFulfillment".equals(event.getString("sagaType"))) return;

            // Perform local action
            inventoryService.reserveStockForSaga(productId, quantity, ...);

            // Update saga state and publish next event
            sagaStateStore.updateOrAddStep(sagaId, 1, StepStatus.COMPLETED);
            hazelcast.getTopic("StockReserved").publish(nextEvent);
        });
    }
}
Three listeners across three services, wired together only by event names. To understand the full flow, you read code in three different modules. Compensation is handled by a CompensationRegistry that maps forward events to their compensating counterparts:
registry.register("OrderCreated", "OrderCancelled", "order-service");
registry.register("StockReserved", "StockReleased", "inventory-service");
registry.register("PaymentProcessed", "PaymentRefunded", "payment-service");
Orchestration: SagaDefinition Builder
The orchestrated version puts the entire saga in one place:
@Component
public class OrderFulfillmentSagaFactory {

    public SagaDefinition create() {
        return SagaDefinition.builder()
                .name("OrderFulfillmentOrchestrated")

                .step("CreateOrder")
                    .action(this::createOrderAction)
                    .compensation(this::createOrderCompensation)
                    .timeout(Duration.ofSeconds(15))
                    .build()

                .step("ReserveStock")
                    .action(this::reserveStockAction)
                    .compensation(this::reserveStockCompensation)
                    .timeout(Duration.ofSeconds(15))
                    .build()

                .step("ProcessPayment")
                    .action(this::processPaymentAction)
                    .compensation(this::processPaymentCompensation)
                    .timeout(Duration.ofSeconds(15))
                    .build()

                .step("ConfirmOrder")
                    .action(this::confirmOrderAction)
                    .noCompensation()
                    .timeout(Duration.ofSeconds(10))
                    .build()

                .sagaTimeout(Duration.ofSeconds(60))
                .build();
    }
}
Four steps, forward actions, compensations, timeouts — all readable in one file. You pay for that readability: the Order Service now has direct knowledge of the Inventory and Payment services’ HTTP endpoints.
The Orchestrator State Machine
HazelcastSagaOrchestrator is the engine that executes a SagaDefinition. The execution flow:

Internally, a SagaExecution instance tracks the running state: current step index, completed step names, an AtomicBoolean for compensation (preventing a race between step failure and the saga-level timeout firing at the same moment), and step start timestamps for duration metrics.
Per-Step Retry
Each SagaStep can configure maxRetries and retryDelay. When a step fails, the orchestrator checks if retries remain. If so, it waits retryDelay milliseconds and re-executes. If not, compensation kicks in.
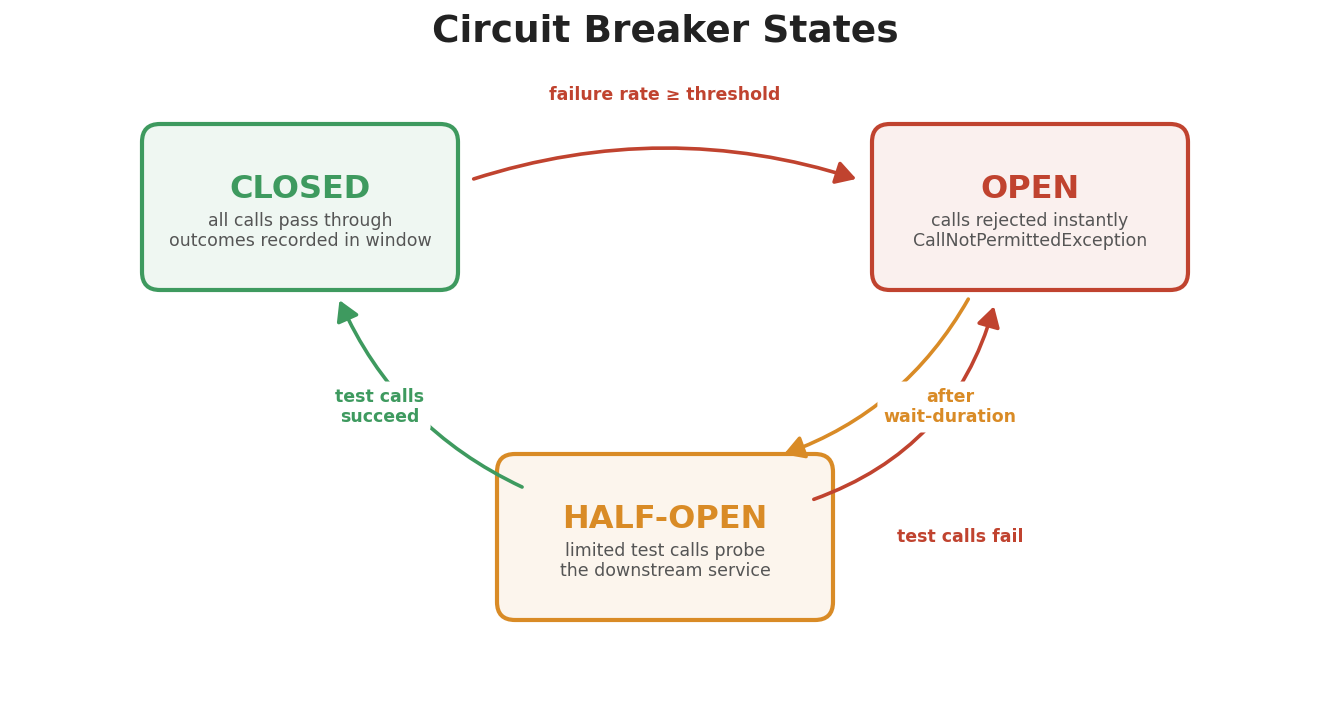
This is separate from the Resilience4j circuit breakers that the choreographed saga listeners use. Different communication styles, different retry mechanisms.
Why HTTP Instead of ITopic?
You might wonder why the orchestrator makes HTTP calls to the other services instead of publishing events on Hazelcast ITopic.
Two reasons.
First, request-response semantics. The orchestrator needs to know whether each step succeeded before proceeding to the next. ITopic is fire-and-forget — there’s no built-in way for a publisher to wait for a consumer’s response. HTTP gives you synchronous request-response for free.
Second, our dual-instance architecture. Each service runs an embedded Hazelcast instance for Jet pipelines and a client to the shared cluster for cross-service events. Jet pipeline lambdas reference service-specific classes that can’t serialize across services — that’s the whole reason for the dual-instance design (see Part 5 for where this architecture first bit us). HTTP sidesteps Hazelcast serialization entirely. Each service processes the request in its own JVM with full access to its own classes.
The SagaServiceClient wraps these calls:
public class SagaServiceClient implements SagaServiceClientOperations {

    public OrchestratedStepResponse reserveStock(
            String productId, int quantity, String orderId) {
        // POST /api/saga/inventory/reserve-stock
        return restTemplate.postForObject(
                inventoryServiceUrl + "/api/saga/inventory/reserve-stock",
                request, OrchestratedStepResponse.class);
    }

    public OrchestratedStepResponse processPayment(
            String orderId, String customerId,
            double amount, String currency, String method) {
        // POST /api/saga/payment/process
        return restTemplate.postForObject(
                paymentServiceUrl + "/api/saga/payment/process",
                request, OrchestratedStepResponse.class);
    }
}
Each remote service exposes dedicated saga endpoints (like /api/saga/inventory/reserve-stock) that return an OrchestratedStepResponse — a success/failure envelope. The SagaServiceClient implements the SagaServiceClientOperations interface, which exists so Mockito can mock it on Java 25. (Mockito’s inline mock maker can’t mock concrete classes there. We hit this in several places — extract an interface, move on.)
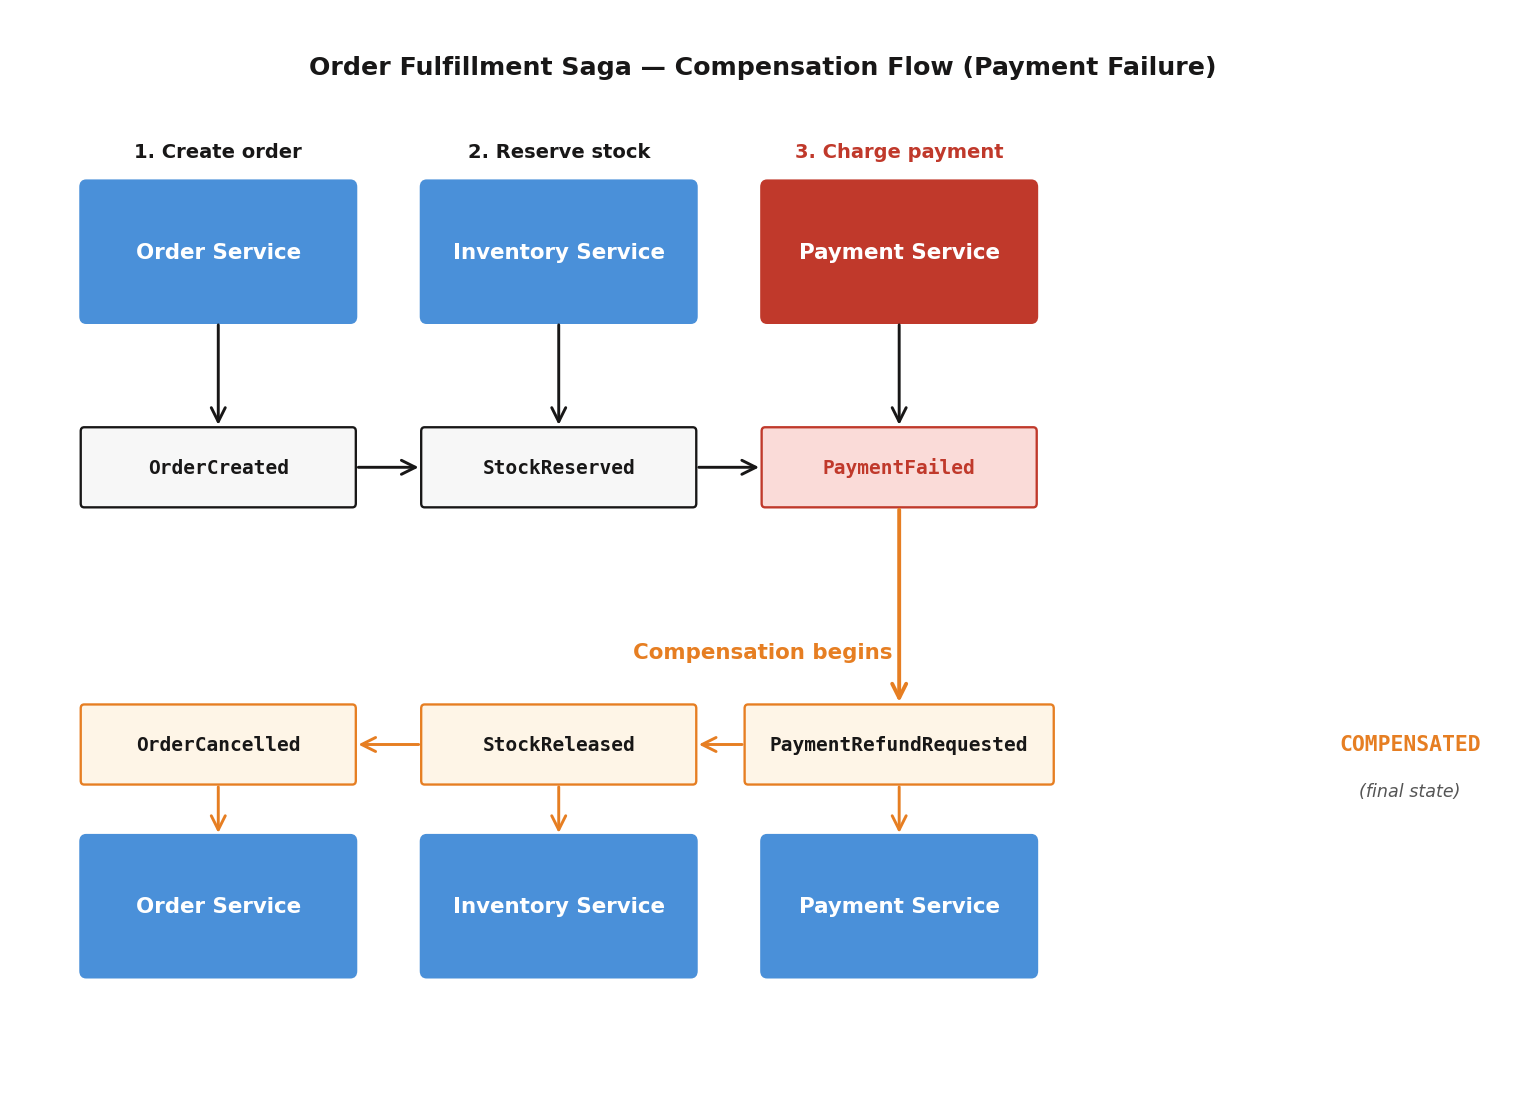
Compensation: Two Approaches
Choreography: Event-Based
When a step fails, the SagaCompensator looks up the CompensationRegistry and publishes compensation events via ITopic:

Each service processes its own compensation event independently. The SagaTimeoutDetector can also trigger this if a saga exceeds its deadline.
Orchestration: Lambda-Based
When a step fails, the orchestrator walks completed steps in reverse and executes their compensation lambdas directly:

No events, no registry. The compensation logic sits right next to the forward action in the SagaDefinition. The final step (ConfirmOrder) uses .noCompensation() — there’s nothing to undo once you’ve confirmed.
If a compensation step itself fails, the orchestrator marks the saga as FAILED rather than COMPENSATED. That means manual intervention. It’s not a situation you want, but at least you know about it immediately rather than discovering it later in an audit.
Running Both Simultaneously
Both patterns coexist in the same system. No interference.
| Pattern | Saga Type | REST Endpoint |
|---|---|---|
| Choreography | OrderFulfillment | POST /api/orders |
| Orchestration | OrderFulfillmentOrchestrated | POST /api/orders/orchestrated |
The key to coexistence is the sagaType field. Choreographed saga listeners filter on it — when the orchestrated flow creates an OrderCreated event, the InventorySagaListener ignores it because the type is “OrderFulfillmentOrchestrated”, not “OrderFulfillment”.
Both patterns write to the same SagaStateStore (a Hazelcast IMap), so you can query across both or filter:
# All sagas
curl http://localhost:8083/api/sagas

# Only choreographed
curl http://localhost:8083/api/sagas?type=OrderFulfillment

# Only orchestrated
curl http://localhost:8083/api/sagas?type=OrderFulfillmentOrchestrated
The MCP list_sagas tool supports the same filter:
list_sagas(type="OrderFulfillmentOrchestrated", status="COMPLETED")
Observability
The orchestrator records a saga.step.duration timer for every step:
private void recordStepDuration(SagaExecution exec, String stepName) {
    if (sagaMetrics != null && exec.stepStartedAt != null) {
        Duration stepDuration = Duration.between(exec.stepStartedAt, Instant.now());
        sagaMetrics.recordStepDuration(
                exec.definition.getName(), stepName, stepDuration);
    }
}
Tagged with sagaType and stepName, so you can query individual steps:
# p95 duration for the ProcessPayment step
histogram_quantile(0.95,
  rate(saga_step_duration_seconds_bucket{
    sagaType="OrderFulfillmentOrchestrated",
    stepName="ProcessPayment"
  }[5m]))
Choreographed sagas track overall saga_duration_seconds but not per-step timing — the flow is distributed across services, so there’s no single place to measure each step. That’s a genuine observability trade-off between the two patterns.
The Grafana saga dashboard has a Choreography vs Orchestration row: p50/p95 duration comparison, success/failure rates per pattern, and an orchestrated step breakdown showing where time goes across CreateOrder, ReserveStock, ProcessPayment, and ConfirmOrder.
The MCP run_demo tool includes orchestrated scenarios:
| Scenario | Pattern | Expected Outcome |
|---|---|---|
| happy_path | Choreographed | Order confirmed via events |
| payment_failure | Choreographed | Stock released via compensation events |
| orchestrated_happy_path | Orchestrated | Order confirmed via HTTP, sync response |
| orchestrated_payment_failure | Orchestrated | Stock released via reverse compensation, 409 response |
The Summary Table
| Choreography | Orchestration | |
|---|---|---|
| Communication | Hazelcast ITopic events | HTTP calls |
| Flow definition | Distributed across listeners | Centralized in SagaDefinition |
| Compensation | CompensationRegistry + event publishing | Reverse-order lambda execution |
| Timeout handling | SagaTimeoutDetector (scheduled) | Per-step + saga-level timeouts |
| Response model | Async (202 Accepted) | Sync (201 Created or 409 Conflict) |
| Retry | Resilience4j (circuit breaker + retry) | Built-in per-step retry with delay |
| Metrics | Saga-level duration | Saga-level + per-step duration |
| Saga type | OrderFulfillment | OrderFulfillmentOrchestrated |
Choreography is still the right default for most event-sourced systems — it preserves service independence and scales naturally. Orchestration earns its place when you need the flow readable in one file, synchronous responses, and fine-grained per-step control.
Both patterns share the same SagaStateStore, the same Grafana dashboards, and the same MCP tools. Pick the right one for each saga, or run both and compare.
Previous: Dead Letter Queue + Idempotency: Exactly-Once on Hazelcast