Part 11 in the “Building Event-Driven Microservices with Hazelcast” series
In Part 9 and Part 10, we finished the reliability and coordination layer — dead letter queues, idempotency guards, two saga patterns. But there’s been a fundamental gap this whole time: every piece of data lives exclusively in Hazelcast IMaps. A full cluster restart erases everything. The event store, the materialized views, the saga state. Gone.
For a demo that runs 30 minutes, that’s fine. For a production system — or even a trade show booth running for hours — it’s not. Events are the source of truth in an event-sourced system. Losing them means losing business history.
This post covers how we added durable persistence to the framework, primarily through Hazelcast’s MapStore mechanism but with one notable exception, without changing a single line of service business logic.
The Problem
Our event sourcing pipeline writes to several types of IMaps: the event store (Customer_ES, Product_ES, etc.), materialized views (Customer_VIEW, Order_VIEW, etc.), and supporting maps for saga state, the outbox, and the DLQ. All in-memory. Hazelcast’s IMap is fast precisely because it avoids disk I/O.
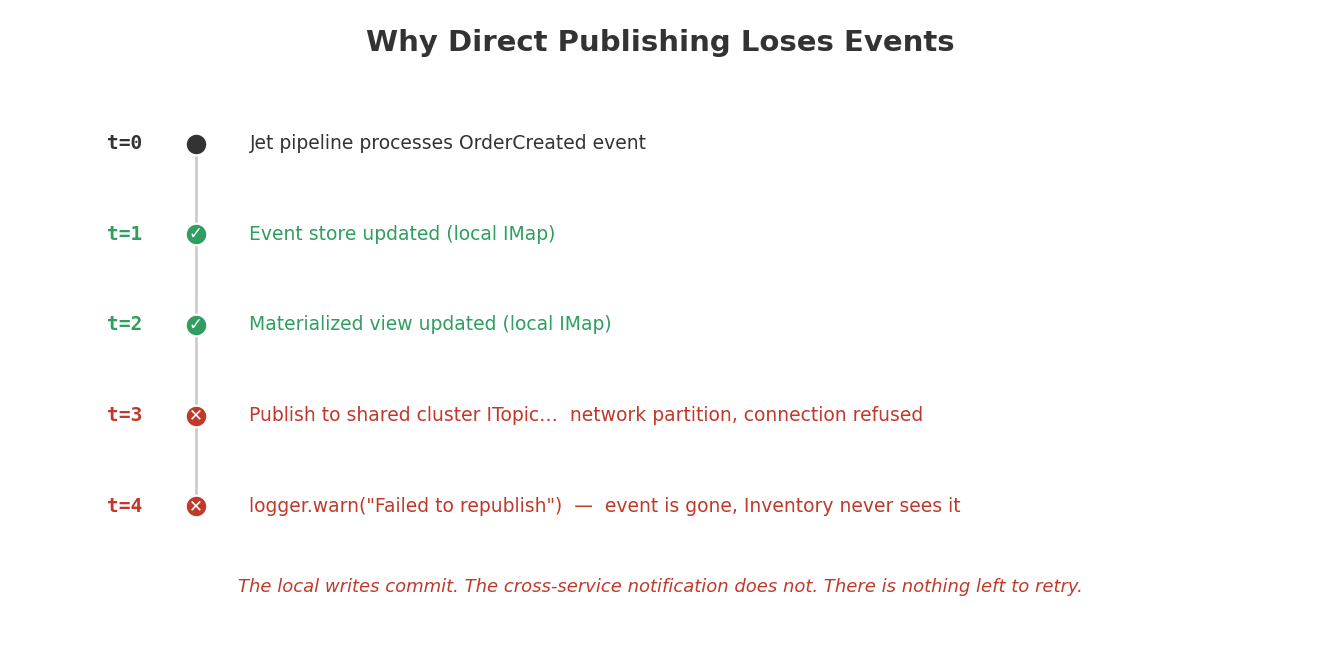
But that creates two problems. First, data loss on restart — the event log is gone, you can’t rebuild views or replay events or audit what happened. Second, unbounded memory growth — during a long-running demo, events accumulate indefinitely, the JVM runs out of heap, and the pod gets OOMKilled. We saw this happen at about the 45-minute mark under sustained load.
We need to persist to a durable store (PostgreSQL) while keeping the in-memory performance characteristics intact.
Why MapStore?
Hazelcast’s MapStore interface is the natural integration point. It’s a callback mechanism — Hazelcast calls your code whenever entries are written to or read from an IMap:
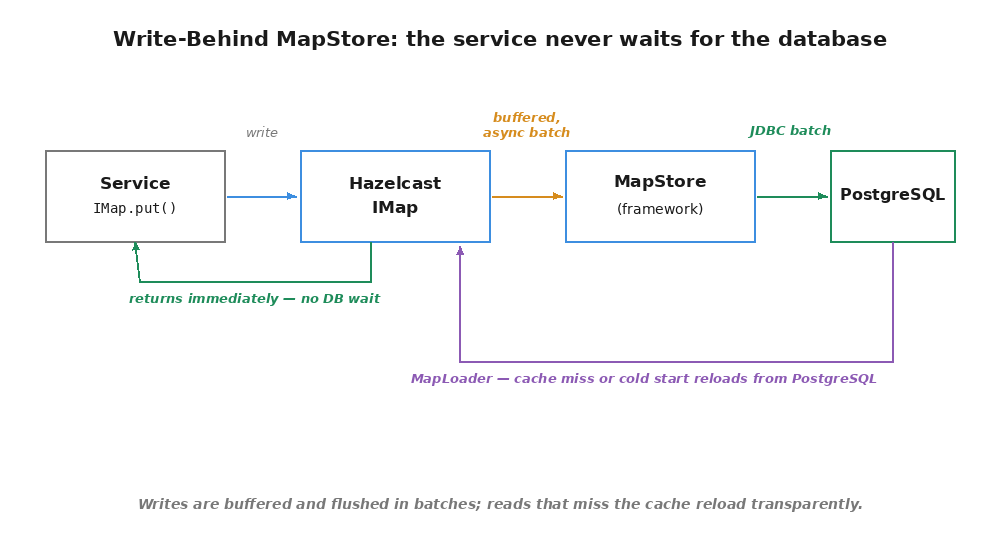
We use write-behind mode. Hazelcast buffers writes and flushes them asynchronously in batches. The IMap.put() call returns immediately — the service never waits for PostgreSQL. This matters because our Jet pipeline calls put() on every event, and we can’t afford database latency in the hot path.
There’s also write-through mode (writeDelaySeconds=0), where every put() synchronously writes to the database. We don’t use it. It would negate the entire point of in-memory processing.
The MapStore also implements MapLoader, which Hazelcast calls on cache misses and cold starts. This gives us automatic rehydration: if a service restarts, the views reload from PostgreSQL without any special recovery code. No replay, no rebuild — the data is just there.
Architecture
The persistence layer splits across two modules, with provider-agnostic interfaces in framework-core and database-specific implementations in framework-postgres. The full design rationale is in ADR 012.
Provider-Agnostic Interfaces (framework-core)
Four persistence interfaces, one per map type:
public interface EventStorePersistence {
    void persist(String mapName, PersistableEvent event);
    void persistBatch(String mapName, List<PersistableEvent> events);
    Optional<PersistableEvent> loadEvent(String mapName, String mapKey);
    Iterable<String> loadAllKeys(String mapName);
    void delete(String mapName, String mapKey);
    boolean isAvailable();
}
ViewStorePersistence follows the same shape but uses upsert semantics — newer entries replace older ones for the same key. OutboxStorePersistence adds loadNonDeliveredKeys() for recovering in-flight entries on restart. DlqStorePersistence adds loadPendingKeys() for the same reason.
These interfaces know nothing about Hazelcast, GenericRecord, or Compact serialization. They operate on portable record types — PersistableEvent, PersistableView, PersistableOutboxEntry, PersistableDeadLetterEntry — simple Java records containing strings and longs. Clean enough for any JDBC-compatible database.
MapStore Adapters (framework-core)
EventStoreMapStore, ViewStoreMapStore, and OutboxMapStore implement Hazelcast’s MapStore interface and delegate to the persistence interfaces above. They handle key serialization (converting PartitionedSequenceKey<String> to a string format like seq:12345|key:cust-001), GenericRecord-to-JSON conversion via GenericRecordJsonConverter, and metadata extraction from GenericRecord fields.
There’s no DLQ MapStore adapter. The DLQ can’t use MapStore at all — more on why below.
PostgreSQL Implementation (framework-postgres)
PostgresEventStorePersistence uses JPA for single-record operations and JdbcTemplate.batchUpdate() for batches. Events use ON CONFLICT DO NOTHING (append-only — if it’s already there, leave it alone). Views and outbox entries use ON CONFLICT DO UPDATE (upsert — latest state wins).
Flyway manages the schema:
CREATE TABLE domain_events (
    map_name       VARCHAR(255) NOT NULL,
    map_key        VARCHAR(512) NOT NULL,
    aggregate_id   VARCHAR(255) NOT NULL,
    sequence       BIGINT NOT NULL,
    event_type     VARCHAR(255) NOT NULL,
    event_data     JSONB NOT NULL,
    timestamp_millis BIGINT NOT NULL,
    correlation_id VARCHAR(255),
    created_at     TIMESTAMPTZ DEFAULT NOW(),
    PRIMARY KEY (map_name, map_key)
);
In-Memory Fallback (framework-core)
Each of the four persistence interfaces has a ConcurrentHashMap-backed in-memory implementation: InMemoryEventStorePersistence, InMemoryViewStorePersistence, InMemoryOutboxStorePersistence, InMemoryDlqStorePersistence. When framework.persistence.enabled=true but no PostgreSQL driver is on the classpath, the auto-configuration falls back to these. The persistence pipeline runs — good for testing the wiring — without requiring an actual database.
How Write-Behind Works
The timeline of a single event being persisted:
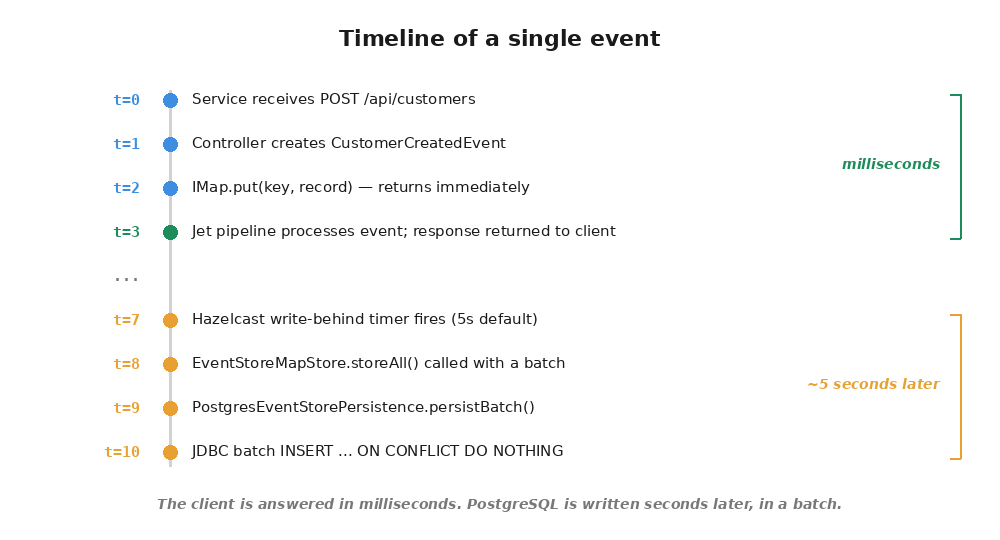
The service responds in milliseconds. The database write happens 5 seconds later, batched with other events.
MapStore Behavior by Map Type
| Aspect | Event Store (_ES) | View Store (_VIEW) | Outbox (framework_OUTBOX) |
|---|---|---|---|
| Write semantics | INSERT (append-only) | UPSERT (latest wins) | UPSERT (status transitions) |
| Coalescing | Disabled — each event is unique | Enabled — only latest state per key | Enabled — only latest status per entry |
| Initial load | LAZY — events loaded on demand | EAGER — all keys loaded on cold start | LAZY — non-delivered entries on demand |
Coalescing is worth explaining. If a customer’s address changes three times during the five-second write-behind window, only the final state gets persisted. That’s correct for views — they represent current state, not history. Events are never coalesced because each one is a distinct historical fact. The outbox coalesces because entries transition through statuses (PENDING → CLAIMED → DELIVERED) and only the latest status matters for recovery.
Bounded Memory with Eviction
Persistence unlocks something else: IMap eviction. Without a backing store, evicting an entry means losing it permanently. With a MapStore behind the map, evicted entries can be reloaded on demand via MapLoader.load().
This turns IMaps into bounded hot caches:
framework:
  persistence:
    enabled: true
    event-store-eviction:
      enabled: true
      max-size: 10000        # per node
      eviction-policy: LRU
    view-store-eviction:
      enabled: true
      max-size: 10000
      eviction-policy: LRU
      max-idle-seconds: 3600  # evict views idle > 1 hour
When the map reaches 10,000 entries, the least recently used ones get evicted. If a subsequent get() hits an evicted key, Hazelcast calls MapLoader.load(), reads from PostgreSQL, and puts the entry back. The service code never knows the difference — it’s the same IMap.get() call either way.
Memory stays bounded. No OOMKill after hours of continuous load. Hot data stays in-memory at sub-millisecond latency. Cold data reloads transparently.
The DLQ Exception: Direct Writes Instead of MapStore
The dead letter queue is the one map that can’t use MapStore. The reason traces directly back to the dual-instance Hazelcast architecture.
The event store, view store, and outbox all live on the embedded Hazelcast instance — the standalone one that runs Jet pipelines inside each service. MapStore is a server-side configuration: you attach it to a map on a Hazelcast member, Hazelcast calls your code when entries change. Works great because the embedded instance is a full member that the service controls.
The DLQ lives on the shared cluster — the external 3-node Hazelcast cluster that services connect to as clients. Services write to the DLQ via hazelcastClient. MapStore is configured on the server side, and the shared cluster nodes don’t have the service’s persistence beans. You simply cannot attach a MapStore to a map accessed through a client connection.
So the DLQ does direct persistence writes. When HazelcastDeadLetterQueue.add(), replay(), or discard() is called, it writes to the IMap and calls DlqStorePersistence.persist() in the same method:
public void add(DeadLetterEntry entry) {
    GenericRecord record = toGenericRecord(entry);
    dlqMap.set(entry.getId(), record);
    persistIfAvailable(entry);
}
Synchronous, not write-behind. The trade-off is fine: DLQ entries are rare — they represent failures — so a database write in the hot path is negligible. If persistence itself fails, the entry is still in the IMap. The failure gets logged, but it doesn’t block the DLQ operation.
On startup, loadFromPersistence() hydrates the IMap with PENDING entries from PostgreSQL. Terminal entries (REPLAYED, DISCARDED) aren’t recovered — they’ve already been handled.
Metrics and Observability
Every MapStore operation is instrumented with Micrometer, following the same ConcurrentHashMap-cached counter/timer pattern used by PipelineMetrics and SagaMetrics:
| Metric | Type | Description |
|---|---|---|
| persistence.store.count | Counter | Single write operations |
| persistence.store.batch.count | Counter | Batch write operations |
| persistence.store.batch.entries | Counter | Total entries across all batches |
| persistence.load.count | Counter | Load operations (cache misses) |
| persistence.load.miss | Counter | Load misses (not in DB either) |
| persistence.delete.count | Counter | Delete operations |
| persistence.errors | Counter | Errors by operation |
| persistence.store.duration | Timer | Write latency (p50/p95/p99) |
| persistence.load.duration | Timer | Load latency (p50/p95/p99) |
A pre-built Grafana dashboard (persistence-dashboard.json) auto-provisions alongside the existing ones and shows throughput by map, latency percentiles, batch sizes, and error rates.
Metrics are optional — MapStore constructors accept a nullable PersistenceMetrics parameter. No MeterRegistry in the context (unit tests, for instance), no metrics. Nothing breaks.
Zero Code Changes in Services
The design goal I cared about most: enabling persistence shouldn’t require touching business logic. The complete diff in a service’s application.yml:
# Add to any service to enable persistence
framework:
  persistence:
    enabled: true

spring:
  datasource:
    url: jdbc:postgresql://localhost:5432/ecommerce
    username: ecommerce
    password: ecommerce
And add framework-postgres as a Maven dependency. That’s it.
The auto-configuration chain handles everything else. PostgresPersistenceAutoConfiguration detects the PostgreSQL driver and creates persistence beans for all four map types. PersistenceAutoConfiguration creates MapStore adapters for event, view, and outbox maps and wires them to the persistence beans. Each service’s config class detects the adapters via @Autowired(required = false) and attaches them to the IMap configurations. DeadLetterQueueAutoConfiguration passes the optional DlqStorePersistence bean directly to HazelcastDeadLetterQueue. Hazelcast handles the write-behind scheduling, batching, and MapLoader callbacks for the MapStore-backed maps.
If framework-postgres isn’t on the classpath, the in-memory fallback kicks in. If framework.persistence.enabled is false (the default), nothing changes at all.
Custom Providers
Swapping PostgreSQL for another database means implementing four interfaces: EventStorePersistence, ViewStorePersistence, OutboxStorePersistence, and DlqStorePersistence. Create an @AutoConfiguration class with @AutoConfigureBefore(PersistenceAutoConfiguration.class), register the beans as @ConditionalOnMissingBean, and add to AutoConfiguration.imports.
The in-memory implementations are about 50 lines each — they serve as a decent reference.
What We Built
| Component | Purpose |
|---|---|
| EventStorePersistence / ViewStorePersistence | Provider-agnostic interfaces (event store, views) |
| OutboxStorePersistence / DlqStorePersistence | Provider-agnostic interfaces (outbox, DLQ) |
| PersistableEvent / PersistableView | Portable records (decoupled from GenericRecord) |
| PersistableOutboxEntry / PersistableDeadLetterEntry | Portable records (outbox, DLQ) |
| EventStoreMapStore / ViewStoreMapStore / OutboxMapStore | Hazelcast MapStore adapters (write-behind) |
| GenericRecordJsonConverter | Compact GenericRecord to/from JSON |
| PostgresEventStorePersistence / PostgresViewStorePersistence | PostgreSQL implementation (events, views) |
| PostgresOutboxStorePersistence / PostgresDlqStorePersistence | PostgreSQL implementation (outbox, DLQ) |
| InMemory*Persistence (x4) | Development/test fallback for all map types |
| PersistenceProperties | Spring Boot configuration (write-delay, batch size, eviction) |
| PersistenceMetrics | Micrometer counters and timers |
| PersistenceAutoConfiguration | Auto-wiring with fallback chain |
Configuration Reference
framework:
  persistence:
    enabled: true                  # Master switch (default: false)
    write-delay-seconds: 5         # Batch window (default: 5)
    write-batch-size: 100          # Max entries per batch (default: 100)
    write-coalescing: false        # Coalesce writes (default: false)
    initial-load-mode: LAZY        # LAZY or EAGER (default: LAZY)
    event-store-eviction:
      enabled: true                # Enable eviction (default: true)
      max-size: 10000              # Max entries per node
      max-size-policy: PER_NODE
      eviction-policy: LRU
      max-idle-seconds: 0          # 0 = no idle eviction
    view-store-eviction:
      enabled: true
      max-size: 10000
      max-size-policy: PER_NODE
      eviction-policy: LRU
      max-idle-seconds: 3600       # Evict idle views after 1 hour
The framework now has a complete data lifecycle: events created in-memory for speed, persisted to PostgreSQL for durability, evicted when memory is constrained, reloaded on demand. The in-memory event sourcing performance is unchanged — PostgreSQL is strictly write-behind, never in the hot path.
The Persistence Guide has the full reference including PostgreSQL setup, custom provider implementation, eviction tuning, and troubleshooting.
Previous: Saga Orchestration vs Choreography on Hazelcast