Part 2 in the “Building Event-Driven Microservices with Hazelcast” series
Introduction
In Part 1 we talked about event sourcing — what it is, why it matters, and how events flow through our framework. What we didn’t talk much about is the thing that actually makes the events flow: the Hazelcast Jet pipeline sitting in the middle of everything.
Jet is Hazelcast’s stream processing engine, and it’s doing all the heavy lifting here. It reads events as they arrive, pushes them through six processing stages — persist, update view, publish, and so on — and it does this with backpressure handling and sub-millisecond latency because everything stays in-memory. No external message broker. No separate stream processor. Jet is embedded right in Hazelcast, which means your event processing pipeline has direct, local access to the same IMaps that store your events and views.
Let’s walk through how it works.
The 6-Stage Pipeline
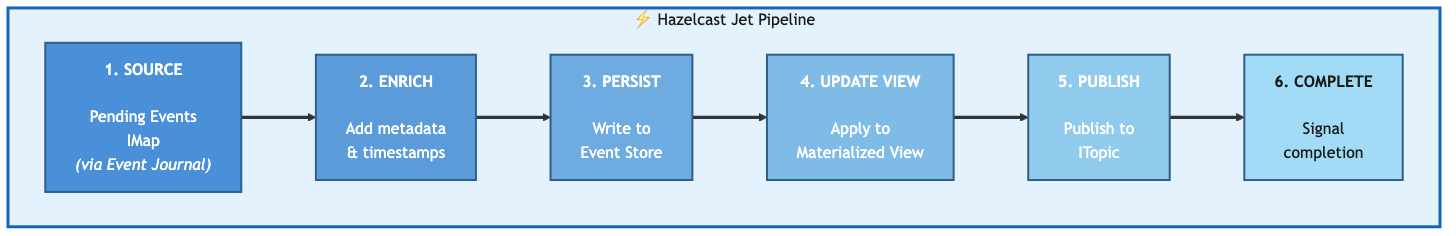
Six stages, each with one task. An event enters on the left and comes out the other side persisted, applied to a view, published to subscribers, and marked complete. If any stage fails, the context carries that information forward so downstream stages can react (usually by skipping).
Stage 1: Source — Reading from Event Journal
The pipeline reads events from the pending events IMap, but not by polling it. That would be terrible — you’d burn CPU checking for new entries, you’d introduce latency, and you’d probably miss things under load. Instead, we use the Event Journal.
The Event Journal is a ring buffer that Hazelcast maintains on each IMap. Every write to the map is recorded in the journal, and Jet can stream directly from it. You configure it on the map:
Config config = new Config();
config.getMapConfig("Customer_PENDING")
    .getEventJournalConfig()
    .setEnabled(true)
    .setCapacity(10000);
And then the pipeline reads from it:
Pipeline pipeline = Pipeline.create();

StreamStage<Map.Entry<PartitionedSequenceKey<K>, GenericRecord>> source = pipeline
    .readFrom(Sources.<PartitionedSequenceKey<K>, GenericRecord>mapJournal(
        pendingMapName,
        JournalInitialPosition.START_FROM_OLDEST
    ))
    .withIngestionTimestamps()
    .setName("1-source-pending-events");
START_FROM_OLDEST means after a restart the pipeline picks up from the beginning of the journal — no events lost. withIngestionTimestamps() stamps each event as it enters the pipeline, which we use later for latency tracking.
PartitionedSequenceKey: Why the Map Key Isn’t a Simple String
You probably noticed the key type is PartitionedSequenceKey<K> rather than, say, a customer ID. There’s a reason for that, and it took us a bit to figure out we needed it.
Jet guarantees that events within the same Hazelcast partition are processed in order. Events across different partitions? No ordering guarantee. They can arrive in any order.
That’s fine as long as all events for a given entity share the same key. But consider this: you create an account keyed by customer ID, then immediately deposit funds into it keyed by transaction ID. Those two keys might hash to different partitions. Jet could process the deposit before the account exists. The deposit fails. The customer calls support. Nobody’s having a good day.
PartitionedSequenceKey separates two concerns that are easy to conflate — the event’s unique identity and the partition it should land on:
public class PartitionedSequenceKey<K>
        implements PartitionAware<K>, Comparable<PartitionedSequenceKey<K>>,
                   Serializable {

    private final long sequence;     // Globally unique FlakeId for ordering
    private final K partitionKey;    // Domain object ID for co-location

    @Override
    public K getPartitionKey() {
        return partitionKey;  // Hazelcast routes by this, not the full key
    }
}
The sequence comes from Hazelcast’s FlakeIdGenerator — globally unique, monotonically increasing. The partitionKey is the domain object’s ID (customer ID, not transaction ID). Because the key implements PartitionAware, Hazelcast uses getPartitionKey() for partition assignment instead of hashing the whole composite key. So the account creation and the deposit both route to the customer’s partition, and Jet processes them in sequence order.
Why This Is Lock-Free
There’s something worth understanding about why partition-aware routing gives us ordered, atomic processing — and it’s not locking.
Hazelcast distributes data across 271 partitions (by default), and each partition is owned by exactly one thread — the partition thread. All operations on keys in that partition are executed by that single thread, sequentially. There’s no concurrent access to fight over, so there’s no need for locks, CAS operations, or synchronized blocks. Two events for customer-123 arrive a millisecond apart? They both route to the same partition, and the partition thread processes them one after the other. Ordering and atomicity come from the threading architecture itself.
This carries through to the materialized view layer too. When we call executeOnKey with an EntryProcessor in Part 3, that processor runs on the partition thread for that key. It reads the current state, applies the event, writes the new state — all in one shot, on one thread, with no possibility of a conflicting update sneaking in between. It’s atomic by construction, not by locking.
The practical payoff is concurrency without contention. Thousands of events per second can flow through the pipeline, and as long as they’re for different entities, they’re processed in parallel across different partition threads. Events for the same entity are serialized — but by the architecture, not by a bottleneck. You get high throughput and strict per-entity ordering at the same time, and you didn’t write a single line of synchronization code to get it.
Stage 2: Enrich — Adding Metadata
Before we do anything with the event, we stamp it with pipeline entry time and extract identification fields. This gives us latency tracking from the moment the event enters the pipeline, not just from when it was created.
StreamStage<EventContext<K>> enriched = source
    .map(EventSourcingPipeline::enrichEvent)
    .setName("2-enrich-metadata");

private static <K> EventContext<K> enrichEvent(
        Map.Entry<PartitionedSequenceKey<K>, GenericRecord> entry) {

    Instant pipelineEntryTime = Instant.now();
    PartitionedSequenceKey<K> key = entry.getKey();
    GenericRecord eventRecord = entry.getValue();

    String eventType = extractEventType(eventRecord);
    String eventId = extractEventId(eventRecord);

    return new EventContext<>(key, eventRecord, eventType, eventId, pipelineEntryTime);
}
(Note the static method — that’s not accidental. We’ll come back to why in the architecture section.)
The EventContext is the envelope that carries the event through all remaining stages:
private static class EventContext<K> implements Serializable {

    final PartitionedSequenceKey<K> key;
    final GenericRecord eventRecord;
    final String eventType;
    final String eventId;
    final Instant pipelineEntryTime;

    // Stage completion flags
    boolean persisted;
    boolean viewUpdated;
    boolean published;

    // Stage timing
    Instant persistTime;
    Instant viewUpdateTime;
    Instant publishTime;
}
Each stage sets its own flag and timestamp. If persist fails, persisted stays false, and the view update stage sees that and skips. No event gets partially applied without the context knowing about it.
Stage 3: Persist — Writing to the Event Store
This is the durability step. Once an event is in the event store, it’s the permanent record of what happened. Everything else — views, notifications, completions — can be rebuilt from events. This one can’t.
EventStoreServiceCreator<D, K, E> eventStoreCreator =
    new EventStoreServiceCreator<>(domainName);

ServiceFactory<?, HazelcastEventStore<D, K, E>> eventStoreFactory =
    ServiceFactories.<HazelcastEventStore<D, K, E>>sharedService(eventStoreCreator)
        .toNonCooperative();

StreamStage<EventContext<K>> persisted = enriched
    .mapUsingService(eventStoreFactory, (store, ctx) -> {
        try {
            Instant start = Instant.now();
            store.append(ctx.key, ctx.eventRecord);
            return ctx.withPersisted(true, start);
        } catch (Exception e) {
            return ctx.withPersisted(false, Instant.now());
        }
    })
    .setName("3-persist-event-store");
The ServiceFactory Pattern
Why the ServiceFactory indirection instead of just passing in an EventStore reference? Because Jet pipelines are distributed. The pipeline definition gets serialized and shipped to whatever nodes Jet decides to run it on. If your lambda captures a reference to a Spring-managed EventStore bean — which holds a HazelcastInstance, database connections, and who knows what else — that serialization is going to fail spectacularly at runtime.
ServiceFactory solves this: you give Jet a recipe for creating the service, and it creates an instance on each node where the pipeline actually runs.
public class EventStoreServiceCreator<D extends DomainObject<K>, K,
        E extends DomainEvent<D, K>>
        implements FunctionEx<ProcessorSupplier.Context, HazelcastEventStore<D, K, E>> {

    private final String domainName;

    @Override
    public HazelcastEventStore<D, K, E> applyEx(ProcessorSupplier.Context ctx) {
        HazelcastInstance hz = ctx.hazelcastInstance();
        return new HazelcastEventStore<>(hz, domainName);
    }
}
The creator itself is just a domain name string — easily serializable. The heavy objects get created on the target node using that node’s local HazelcastInstance.
Stage 4: Update View — Applying to Materialized View
With the event persisted, we update the materialized view. This is where the event’s apply logic runs — transforming the event into current state.
ViewUpdaterServiceCreator<K> serviceCreator =
    new ViewUpdaterServiceCreator<>(domainName, viewUpdaterClass);

ServiceFactory<?, ViewUpdater<K>> viewUpdaterServiceFactory =
    ServiceFactories.<ViewUpdater<K>>sharedService(serviceCreator)
        .toNonCooperative();

StreamStage<EventContext<K>> viewUpdated = persisted
    .mapUsingService(viewUpdaterServiceFactory, (viewUpdater, ctx) -> {
        if (!ctx.persisted) {
            return ctx;  // Skip if persist failed
        }
        try {
            Instant start = Instant.now();
            viewUpdater.updateDirect(ctx.eventRecord);
            return ctx.withViewUpdated(true, start);
        } catch (Exception e) {
            logger.warn("Failed to update view for event: {}", ctx.eventId, e);
            return ctx.withViewUpdated(false, Instant.now());
        }
    })
    .setName("4-update-materialized-view");
The ViewUpdater is an abstract class — each domain implements its own:
public abstract class ViewUpdater<K> implements Serializable {

    protected final transient HazelcastViewStore<K> viewStore;

    protected abstract K extractKey(GenericRecord eventRecord);

    protected abstract GenericRecord applyEvent(
        GenericRecord eventRecord,
        GenericRecord currentState);

    public GenericRecord updateDirect(GenericRecord eventRecord) {
        K key = extractKey(eventRecord);
        GenericRecord currentState = viewStore.get(key).orElse(null);
        GenericRecord updatedState = applyEvent(eventRecord, currentState);

        if (updatedState != null) {
            viewStore.put(key, updatedState);
        } else if (currentState != null) {
            viewStore.remove(key);  // Deletion event
        }

        return updatedState;
    }
}
And here’s what a concrete one looks like for customers:
public class CustomerViewUpdater extends ViewUpdater<String> {

    @Override
    protected String extractKey(GenericRecord eventRecord) {
        return eventRecord.getString("key");
    }

    @Override
    protected GenericRecord applyEvent(GenericRecord event, GenericRecord current) {
        String eventType = event.getString("eventType");

        return switch (eventType) {
            case "CustomerCreated" -> createCustomerView(event);
            case "CustomerUpdated" -> updateCustomerView(event, current);
            case "CustomerStatusChanged" -> changeStatus(event, current);
            case "CustomerDeleted" -> null;  // Return null to delete
            default -> current;
        };
    }

    private GenericRecord createCustomerView(GenericRecord event) {
        return GenericRecordBuilder.compact("Customer")
            .setString("customerId", event.getString("key"))
            .setString("email", event.getString("email"))
            .setString("name", event.getString("name"))
            .setString("address", event.getString("address"))
            .setString("status", "ACTIVE")
            .setInt64("createdAt", Instant.now().toEpochMilli())
            .build();
    }
}
Returning null from applyEvent is the deletion convention — the updater removes the entry from the view. Everything else either creates or modifies the view record.
Stage 5: Publish — Notifying Other Services via ITopic
Once the view is updated, we publish the event so other services can react. This is where cross-service communication happens. Saga listeners subscribe to topics like “OrderCreated” or “StockReserved” and kick off their own workflows when those events arrive.
EventTopicPublisherServiceCreator publisherCreator = new EventTopicPublisherServiceCreator();
ServiceFactory<?, EventTopicPublisherServiceCreator.TopicPublisher> publisherFactory =
    ServiceFactories.<EventTopicPublisherServiceCreator.TopicPublisher>sharedService(publisherCreator)
        .toNonCooperative();

StreamStage<EventContext<K>> published = viewUpdated
    .mapUsingService(publisherFactory, (publisher, ctx) -> {
        if (!ctx.viewUpdated) {
            return ctx;
        }
        try {
            publisher.publish(ctx.eventType, ctx.eventRecord);
            return ctx.withPublished(true, Instant.now());
        } catch (Exception e) {
            logger.warn("Failed to publish event {} to topic: {}",
                ctx.eventId, ctx.eventType, e);
            return ctx.withPublished(false, Instant.now());
        }
    })
    .setName("5-publish-to-subscribers");
The TopicPublisher is thin — it resolves the ITopic by event type name and publishes:
public class EventTopicPublisherServiceCreator
        implements FunctionEx<ProcessorSupplier.Context, TopicPublisher> {

    @Override
    public TopicPublisher applyEx(ProcessorSupplier.Context ctx) {
        return new TopicPublisher(ctx.hazelcastInstance());
    }

    public static class TopicPublisher {
        private final HazelcastInstance hazelcast;

        public void publish(String topicName, GenericRecord record) {
            ITopic<GenericRecord> topic = hazelcast.getTopic(topicName);
            topic.publish(record);
        }
    }
}
Each event type gets its own ITopic. The Order service subscribes to StockReserved and PaymentProcessed; the Inventory service subscribes to OrderPlaced. Nobody hears events they can’t act on.
Stage 6: Complete — Signaling Completion (and Smuggling Out Metrics)
The last stage writes a completion record so the calling code knows the event made it through. But there’s a twist.
Jet pipelines run inside Hazelcast’s execution engine. They don’t have access to Spring’s MeterRegistry, or any external metrics system. The pipeline can time every stage internally — it does, that’s what all those Instant.now() calls are for — but it has no way to report those timings to Prometheus or Grafana directly.
So we cheat. The completion record carries the timestamps out:
published.map(ctx -> {
    long completionMs = Instant.now().toEpochMilli();
    GenericRecord completion = GenericRecordBuilder.compact("PipelineCompletion")
            .setString("eventId", ctx.eventId)
            .setString("eventType", ctx.eventType)
            .setBoolean("persisted", ctx.persisted)
            .setBoolean("viewUpdated", ctx.viewUpdated)
            .setBoolean("published", ctx.published)
            .setInt64("pipelineEntryMs", ctx.pipelineEntryTime.toEpochMilli())
            .setInt64("persistStartMs",
                ctx.persistTime != null ? ctx.persistTime.toEpochMilli() : 0L)
            .setInt64("viewUpdateStartMs",
                ctx.viewUpdateTime != null ? ctx.viewUpdateTime.toEpochMilli() : 0L)
            .setInt64("publishTimeMs",
                ctx.publishTime != null ? ctx.publishTime.toEpochMilli() : 0L)
            .setInt64("completionMs", completionMs)
            .build();
    return Map.entry(ctx.eventId, completion);
})
.writeTo(Sinks.map(completionsMapName))
.setName("6-signal-completion");
The controller picks up the completion, extracts the timestamps, and reports them to Micrometer. The pipeline instruments itself; the controller publishes the metrics. It also gets the stage success flags — persisted, viewUpdated, published — so it knows whether the event made it through clean or had partial failures along the way.
The controller side looks like this:
public CompletableFuture<EventCompletion> handleEvent(DomainEvent event, UUID correlationId) {
    pendingEventsMap.set(key, eventRecord);

    return CompletableFuture.supplyAsync(() -> {
        int maxWait = 5000;
        int elapsed = 0;

        while (elapsed < maxWait) {
            GenericRecord completion = completionsMap.get(key);
            if (completion != null) {
                return EventCompletion.success(eventId);
            }
            Thread.sleep(10);
            elapsed += 10;
        }
        throw new TimeoutException("Event processing timeout");
    });
}
Write the event to the pending map, then poll the completions map until the pipeline writes the result. Five seconds is plenty — the pipeline usually finishes in under a millisecond.
Jet Pipeline Traps (and How We Avoid Them)
If you’re used to writing normal Java code, Jet pipelines will surprise you in a few unpleasant ways. These are the ones that cost us the most time.
The Serialization Trap
Every lambda in the pipeline must be serializable, because Jet ships the pipeline definition to whichever nodes it decides to run on. If your lambda captures this, and this has a HazelcastInstance field, or a Spring ApplicationContext, or anything else that doesn’t serialize — you get a NotSerializableException at runtime. Not at compile time. At runtime. In production, ideally on a Friday.
Three rules keep you out of trouble:
Use static methods as pipeline stages (they don’t capture this). Use ServiceFactory for anything that needs a Hazelcast instance or other heavy resource. And if you must capture a value, make sure it’s a final local variable that’s actually serializable.
// This will ruin your weekend
.map(event -> this.eventStore.append(event))

// This will not
.mapUsingService(eventStoreFactory, (store, event) -> store.append(event))
The Try-Catch That Catches Nothing
This one’s sneaky. Your instinct when writing the pipeline is to wrap the whole thing in a try-catch:
try {
    Pipeline pipeline = Pipeline.create();
    // ... define all six stages ...
    hazelcast.getJet().newJob(pipeline, jobConfig);
} catch (Exception e) {
    logger.error("Pipeline failed!", e);  // This catches almost nothing useful
}
That try-catch protects you during pipeline assembly — if you misspell a map name or pass an invalid config, you’ll catch it. But assembly isn’t where things go wrong. Things go wrong during execution, and by that point your code is somewhere else entirely.
When you call newJob(), Jet takes your pipeline definition, converts each stage into a processor, and distributes those processors across the cluster. The actual event processing happens inside those distributed processors, on whichever nodes Jet assigned them to. You’re not just off the end of that try-catch block — you might not even be on the same machine.
That’s why every stage in our pipeline has its own try-catch inside the lambda:
.mapUsingService(eventStoreFactory, (store, ctx) -> {
    try {
        store.append(ctx.key, ctx.eventRecord);
        return ctx.withPersisted(true, Instant.now());
    } catch (Exception e) {
        logger.error("Persist failed for event {}", ctx.eventId, e);
        return ctx.withPersisted(false, Instant.now());
    }
})
The error handling has to live where the code actually runs — inside each processor, on whatever node Jet put it on. Downstream stages check the context flags before doing work. If persist failed, the view update skips. If the view update failed, publish skips. The completion record captures exactly what happened, so you can diagnose partial failures from the metrics.
Cooperative, Non-Cooperative, Shared, and Non-Shared
Jet services have two dimensions you need to get right, and they’re independent of each other.
Cooperative vs. non-cooperative is about blocking. Jet’s default threading model is cooperative — stages share a thread pool and are expected to yield quickly. If a stage does I/O (writes to the event store, makes a network call, publishes to ITopic), it blocks the thread. Mark it non-cooperative so Jet gives it a dedicated thread:
ServiceFactory<?, EventStore> factory = ServiceFactories
    .sharedService(creator)
    .toNonCooperative();
Forget this and your pipeline stalls under load. The cooperative thread pool gets monopolized by I/O-bound stages that never yield, and throughput craters.
Shared vs. non-shared is about thread safety. A shared service creates one instance per node and hands it to all processors on that node — multiple threads will call it concurrently. A non-shared service creates a separate instance for each processor, so no concurrent access.
Our EventStore and TopicPublisher are backed by Hazelcast data structures (IMap, ITopic), which are thread-safe, so they’re shared. But if you had a service that accumulated state in a local buffer, or maintained a non-thread-safe connection like a raw JDBC Connection, you’d mark it non-shared:
// Thread-safe service — one instance shared across processors on this node
ServiceFactories.sharedService(creator).toNonCooperative();

// NOT thread-safe — each processor gets its own instance
ServiceFactories.nonSharedService(creator).toNonCooperative();
Get the combination wrong and you get either unnecessary memory overhead (non-shared when shared would do) or, worse, data corruption from concurrent access to a non-thread-safe service (shared when it shouldn’t be). That second one is the kind of bug that shows up intermittently under load and makes you question your career choices.
Lifecycle Management
Starting and stopping the pipeline:
public class EventSourcingPipeline<D, K, E> {

    private volatile Job pipelineJob;

    public Job start() {
        if (pipelineJob != null && !pipelineJob.isUserCancelled()) {
            logger.warn("Pipeline already running");
            return pipelineJob;
        }

        Pipeline pipeline = buildPipeline();
        JobConfig jobConfig = new JobConfig()
            .setName(domainName + "-EventSourcingPipeline");

        pipelineJob = hazelcast.getJet().newJob(pipeline, jobConfig);
        logger.info("Started pipeline for {}, jobId: {}",
            domainName, pipelineJob.getId());
        return pipelineJob;
    }

    public void stop() {
        if (pipelineJob != null) {
            pipelineJob.cancel();
            logger.info("Stopped pipeline for {}", domainName);
        }
    }
}
Each domain (Customer, Order, Inventory) gets its own pipeline instance running as a Jet job. They’re independent — you can restart the Order pipeline without affecting Customers.
Performance
All of this runs on a single Apple MacBook Pro (M4, 16GB) with three Hazelcast instances in Docker Compose:
| Metric | Value |
|---|---|
| Throughput | 100,000+ events/sec |
| P50 Latency | < 0.3ms |
| P99 Latency | < 1ms |
| P99.9 Latency | < 5ms |
That’s the materialized view layer — events flowing through the pipeline and out the other side. It’s fast because everything is in-memory, Jet parallelizes across partitions, the Event Journal provides non-blocking streaming, and views and events live on the same cluster (no network hop for the view update).
We verify it with a load test that submits 100K events and waits for all completions:
// Load test
@Test
void loadTest_100KEvents() {
    int eventCount = 100_000;
    List<CompletableFuture<?>> futures = new ArrayList<>();
    long start = System.nanoTime();

    for (int i = 0; i < eventCount; i++) {
        CustomerCreatedEvent event = createTestEvent(i);
        futures.add(controller.handleEvent(event, UUID.randomUUID()));
    }

    CompletableFuture.allOf(futures.toArray(new CompletableFuture[0])).join();

    long duration = System.nanoTime() - start;
    double tps = eventCount / (duration / 1_000_000_000.0);
    System.out.printf("Processed %d events in %dms (%.0f TPS)%n",
        eventCount, duration / 1_000_000, tps);
}
Monitoring
The pipeline metrics — events processed, processing time histograms, pending event counts — feed into Micrometer and from there to Prometheus and Grafana. We’ll dig into the observability setup in a later post, but here’s the shape of it:
public class PipelineMetrics {

    private final Counter eventsProcessed;
    private final Timer eventProcessingTime;

    public PipelineMetrics(MeterRegistry registry, String domainName) {
        this.eventsProcessed = Counter.builder("events.processed")
            .tag("domain", domainName)
            .register(registry);

        this.eventProcessingTime = Timer.builder("events.processing.time")
            .tag("domain", domainName)
            .register(registry);
    }
}
Remember how Stage 6 smuggles timing data out in the completion record? This is where it ends up — the controller reads the timestamps, calculates durations, and records them here.
That’s the pipeline. Six stages, each with one task, connected by an EventContext that carries the event and its processing history all the way through. The design decisions that matter most: PartitionedSequenceKey for ordering, ServiceFactory for distributed service access, static methods to dodge serialization traps, and a completion record that doubles as a metrics transport.
Next up we’ll look at what happens after Stage 4 in more detail — how materialized views are designed, queried, and rebuilt.
Next up: Materialized Views for Fast Queries
Previous: Event Sourcing with Hazelcast: A Practical Introduction

Leave a comment