Part 13 in the “Building Event-Driven Microservices with Hazelcast” series
Over the previous twelve articles, we built an event-sourced microservices framework with Hazelcast: a Jet-powered event pipeline, materialized views, saga orchestration, circuit breakers, a transactional outbox, dead letter queues, and durable persistence with write-behind MapStore. The framework works. But “works” and “works under load” are different things.
This post covers what happened when we subjected the framework to serious performance engineering: flame graphs, micro-benchmarks, sustained load tests, A-B testing of Enterprise features, and scaling from a single Docker Compose host to a 5-node AWS EKS cluster. We found (and fixed) real bottlenecks, learned where time actually goes in an event-sourced system, and discovered that the biggest performance breakthrough came not from code optimization but from an architectural decision about clustering.
The Measurement Stack
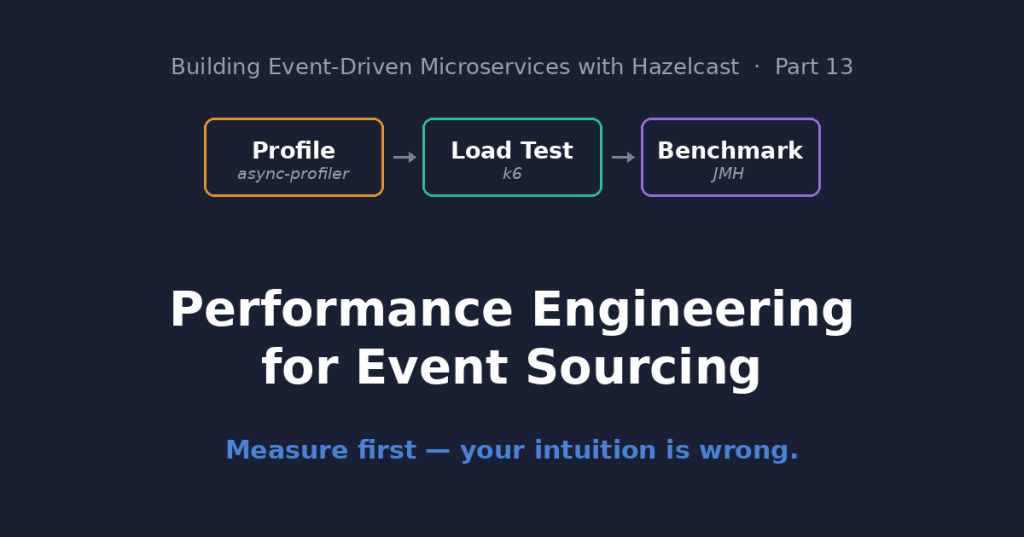
Before optimizing anything, we needed to measure. Four tools, each covering a different level.
k6 handles HTTP load generation. The critical design choice: constant-arrival-rate executor, which sends requests at a fixed rate regardless of response time. The alternative — constant-vus — hides latency. When responses slow down, it sends fewer requests, which makes latency appear stable when it’s actually degrading. This is called coordinated omission, and it’s the most common load testing mistake. We almost made it.
async-profiler produces CPU and allocation flame graphs. We baked it into a Docker profiling image so we could capture 30-second flame graphs under load without restarting services. On macOS Docker Desktop, perf_events isn’t available, so we used itimer (wall-clock) mode.
Prometheus and Grafana handle time-series metrics. The framework registers 46 application-level Micrometer metrics across pipeline, saga, persistence, and gateway components. Six pre-built dashboards cover everything from event flow to JVM heap usage.
JMH handles micro-benchmarks. When we needed to isolate the cost of a single operation — serialization, IMap write, FlakeIdGenerator — we used JMH’s rigorous warmup-and-fork methodology to get microsecond-accurate measurements.
We also built supporting infrastructure: a Bash 3.2-compatible A-B test harness that automates clean-slate Docker Compose restarts, load generation, and comparison reports; a 30-minute sustained load orchestrator with automated Grafana dashboard screenshot capture; and a K8s TPS sweep script that tests across multiple concurrency levels.
Finding Bottlenecks with Flame Graphs
The first real surprise came from async-profiler. We ran a CPU flame graph on order-service at 25 TPS and found this:
Subsystem
CPU %
Hazelcast (IMap ops, Jet, serialization)
52%
Spring/Tomcat HTTP
32%
Outbox polling
24%
Compact serialization
10%
Jet pipeline
9%
The outbox publisher — the component that reads pending outbox entries and publishes them to ITopic — was consuming nearly a quarter of all CPU. A background scheduled task. It doesn’t appear in HTTP latency metrics at all.
Why? It was calling IMap.values(predicate) on a map with no indexes, forcing a full partition scan and deserialization of every entry on every poll cycle.
The fix was three changes:
Add a HASH index on status and a SORTED index on createdAt
Switch from values(predicate) to a PagingPredicate with server-side sort and page limit
Use keySet(predicate).size() instead of values(predicate).size() for count queries
CPU halved. Total allocations dropped by a third. And no new hotspot emerged — the post-optimization profile showed a healthy distribution across Hazelcast internals, Spring HTTP handling, and Jet pipeline processing.
Without the flame graph, I probably would have guessed that serialization or Jet was the bottleneck. Would have been wrong.
Measuring What Matters: JMH Micro-Benchmarks
After identifying system-level hotspots, we wanted to know the per-operation cost of framework internals. Twenty JMH benchmark methods, measuring every operation in the event processing pipeline:
Operation
Cost (us)
% of Total
FlakeIdGenerator.newId()
15.6
42%
EventStore.append (IMap.set)
11.2
30%
ViewStore.executeOnKey
9.3
25%
Event.toGenericRecord (14 fields)
1.1
3%
Total per-event
~37
Total per-event framework cost: 37 microseconds. Pipeline end-to-end p50: 8.7 milliseconds. Framework internals account for less than 0.5% of pipeline latency. The other 99.5% is system overhead — Jet scheduling, thread context switching, HTTP processing, cross-service saga coordination.
The surprise was FlakeIdGenerator. At 15.6 us per call, it’s the single most expensive operation — more than the IMap write it precedes. And it scales poorly under contention: 4 threads = 69 us (4.4x slower), 8 threads = 151 us (9.7x). The batch allocation mechanism (default 100 IDs per batch) amortizes this, but at high concurrency it becomes a real bottleneck. Fix: increase setPrefetchCount() for high-throughput services.
We also benchmarked the shared 3-node Hazelcast cluster. Network operations cost 270-340 us each — about 30-40x more than the equivalent embedded operation. A full saga cycle (8 cluster operations) costs ~2.4 ms, or 28% of pipeline latency. The remaining 72% is Jet + HTTP + thread coordination.
Hazelcast is a significant cost contributor at ~28%, but it’s not the bottleneck. The optimization opportunities are in system-level overhead, not in Hazelcast or framework code.
The Enterprise Edition Question
We built a reusable A-B testing harness and ran three head-to-head comparisons at 50 TPS:
Test
Verdict
Community vs HD Memory
Community wins 4/4 p95 metrics. HD Memory adds serialization overhead crossing the JVM heap boundary. At small scale (~200 entries), the per-access cost outweighs GC savings.
Community vs TPC
TPC wins 3/4 p95 metrics but by only 0.5-1.1ms. 14% lower max latency. Marginal at this scale.
Community vs High Memory (512→1024M)
No meaningful difference. Services aren’t memory-constrained at 50 TPS for 3 minutes.
The honest answer: at 50 TPS with a few hundred entries, Enterprise features don’t help. HD Memory’s native off-heap storage adds measurable per-access overhead that only pays off when GC pressure from millions of on-heap entries causes latency spikes. TPC’s event-loop architecture shows promise for higher concurrency but is marginal at this scale.
Enterprise Edition becomes valuable at much larger scale — millions of entries for HD Memory, hundreds of TPS per service for TPC, or when you need CP Subsystem for distributed locking (though that doesn’t apply in our dual-instance architecture). We’re not there yet with this demo workload.
Scaling to Production: Docker Compose to AWS EKS
We tested four deployment tiers across six TPS levels (10 to 500):
Tier
Nodes
Max TPS
Saga p95
Cost/hr
Local (Docker Desktop)
1
50
< 300ms
$0
AWS Small (2x t3.xlarge)
2
100
< 650ms
$0.76
AWS Medium (3x c7i.2xlarge)
3
200*
Timeout*
$1.18
AWS Large (5x c7i.4xlarge)
5
200
< 1s
$3.50
*Without per-service clustering.
The Medium tier told a puzzling story. HTTP request latency was excellent — sub-120ms p95 — and HPA scaled services to 3 replicas. But saga end-to-end completion hit the 10-second polling timeout at 50+ TPS. HPA was scaling pods, but the new replicas weren’t helping.
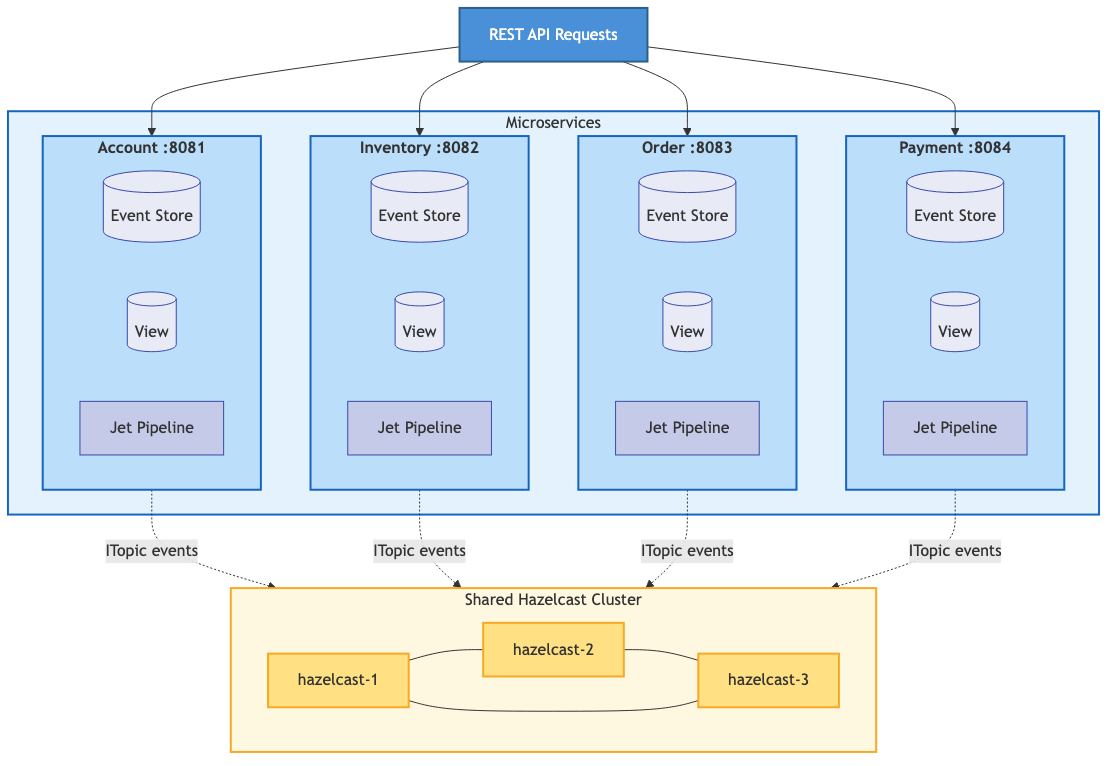
We spent a while staring at this before the root cause clicked: each embedded HazelcastInstance was running as a cluster-of-1. Kubernetes load-balanced saga poll requests across replicas, but only one pod owned the saga state IMap. About 50% of polls missed — they hit a replica that didn’t have the data.
The fix was per-service embedded clustering (ADR 013): same-service replicas form their own Hazelcast cluster via Kubernetes DNS discovery. Different service types remain isolated.
The results:
Metric
Without Clustering
With Clustering
Saga E2E p95 (10 TPS)
10,161ms (timeout)
513ms
Saga E2E p95 (50 TPS)
10,197ms (timeout)
644ms
200 TPS sub-1s saga
Impossible
Yes
Service CPU at 500 TPS
9-10% (idle)
86-98% (utilized)
HPA replicas (25+ TPS)
Stuck at base
2 → 5
A 95% improvement in saga latency. Larger than all code optimizations combined. The clustering change didn’t make any individual operation faster — it made the entire system’s resources actually usable. The CPUs that were sitting at 9% utilization were now doing real work.
Sustained Load: What Breaks After 30 Minutes
Short load tests — 3 minutes — miss the slow killers. We ran a 30-minute sustained test at 50 TPS and found the problems that only surface over time:
Order-service hit the 512Mi memory ceiling at 12 minutes and ran under continuous GC pressure for the remaining 18 minutes. CPU spiked from ~30% to 60% at the ceiling — GC thrashing. Max latency spikes of 5.6 seconds, almost certainly Full GC pauses. Remarkably, no OOM kills. The JVM GC kept services alive. Barely.
All four services showed the same pattern: rapid memory growth, hit ceiling, GC-capped plateau. The root cause: IMap data grows monotonically (event store, views, completions) with EvictionPolicy.NONE.
We bumped container memory from 512Mi to 1Gi (JVM heap 512m → 768m), added MaxSizePolicy.PER_NODE with 50K entries as a safety net on the completions map, and — when PostgreSQL persistence is active — LRU eviction turns IMaps into bounded hot caches. After the fixes, services run comfortably at 50 TPS for 30+ minutes without approaching the memory ceiling.
What We Learned
Always profile before optimizing. The #1 CPU hotspot was a background task that doesn’t appear in HTTP latency metrics. Without flame graphs, we would have optimized the wrong thing.
Framework code is less than 1% of latency. Total per-event cost of serialization, IMap writes, and FlakeIdGenerator: ~37 us. Pipeline p50: 8.7 ms. System overhead dominates by 200x.
Architecture beats optimization. Per-service clustering improved saga latency by 95% — more than all code optimizations combined. When your code is fast but your system is slow, the answer is usually architectural.
constant-arrival-rate is non-negotiable for load testing. The difference between it and constant-vus is the difference between measuring real latency and measuring a fiction.
Enterprise features have a scale threshold. HD Memory and TPC don’t help at 50 TPS with 200 entries. They’re designed for datasets and concurrency levels 10-100x larger than our demo.
Memory limits need sustained testing. A 3-minute test at 512Mi looks fine. A 30-minute test reveals services running at 99.9% memory under GC pressure. Always test for the duration you’ll actually run.
Measure at every layer. HTTP latency, pipeline latency, saga latency, and per-operation cost tell different stories. Saga E2E can time out at 10s+ while HTTP p95 is 30ms. You need all four layers to understand what’s happening.
Tools and Resources
Tool
Purpose
Location
k6 load tests
HTTP load generation at constant arrival rate
scripts/perf/
async-profiler
CPU and allocation flame graphs
docker/profiling/
JMH benchmarks
Micro-benchmark framework internals
framework-core/src/jmh/
A-B test harness
Automated configuration comparison
scripts/perf/ab-test.sh
Grafana dashboards
6 pre-built dashboards (46 metrics)
docker/grafana/dashboards/
K8s perf test
Multi-tier TPS sweep
scripts/perf/k8s-perf-test.sh
Performance tuning guide
Full adopter guide
docs/guides/performance-tuning-guide.md
Production checklist
Quick-reference for deployment
docs/perf/production-checklist.md
Every one of the findings in this post was invisible without measurement. The outbox was burning a quarter of the CPU. The clustering was the real bottleneck. The memory was quietly filling up. Enterprise features we expected to matter didn’t. That’s the point of performance engineering — your intuition about what’s slow is usually wrong. Measure first.
Part 8 in the “Building Event-Driven Microservices with Hazelcast” series
Introduction
In Part 7, we added circuit breakers and retry to protect saga listeners from transient failures on the consumer side. That covers what happens when a service receives an event and can’t process it. But we haven’t talked about what happens when the event never leaves the building.
Quick refresher on our dual-instance architecture: each service runs an embedded Hazelcast instance for local Jet pipeline processing and a client connected to the shared cluster for cross-service ITopic communication. After the pipeline processes an event, the EventSourcingController republishes it to the shared cluster so saga listeners in other services can react.
That republish step? It was a fire-and-forget call:
// The old approach — fragile
try {
    ITopic<GenericRecord> topic = sharedHazelcast.getTopic(pending.eventType);
    topic.publish(pending.eventRecord);
} catch (Exception e) {
    logger.warn("Failed to republish event {}: {}", pending.eventType, e.getMessage());
    // Event is permanently lost!
}
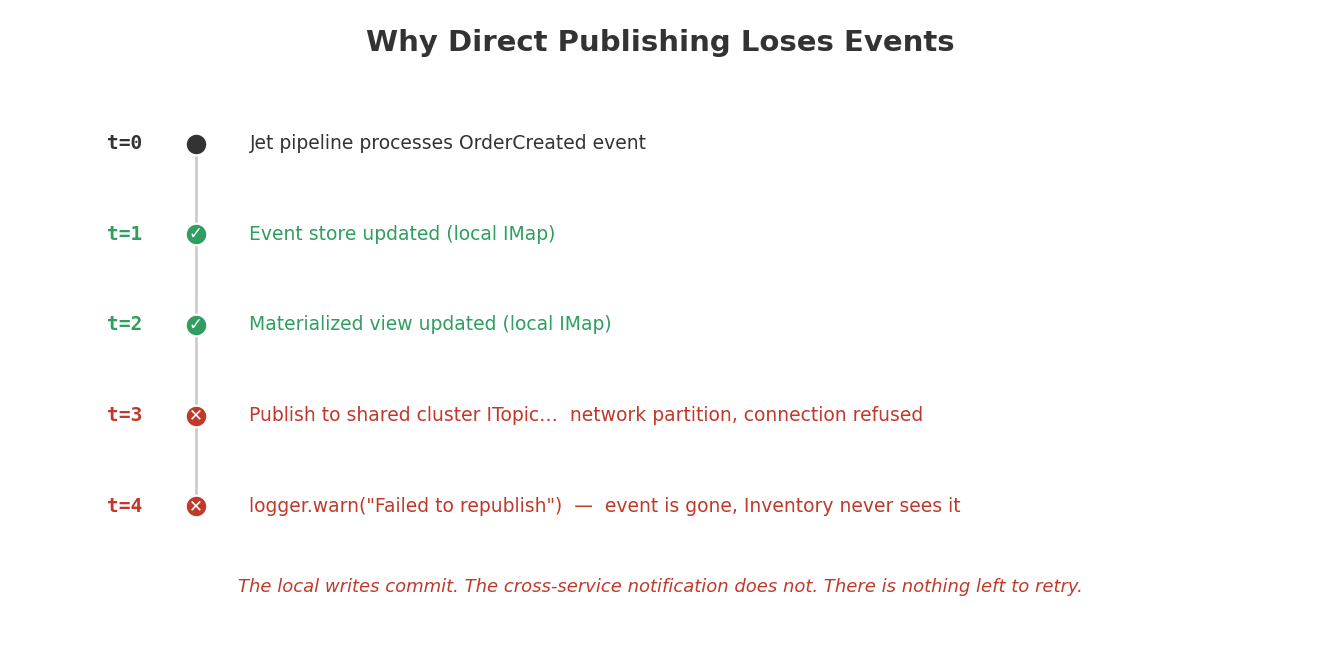
If the shared cluster is unreachable — network partition, cluster restart, someone tripping over the power cable — the event vanishes. The saga never progresses. Eventually the saga timeout detector marks it as failed, but by then the original event data is gone and there’s nothing to retry.
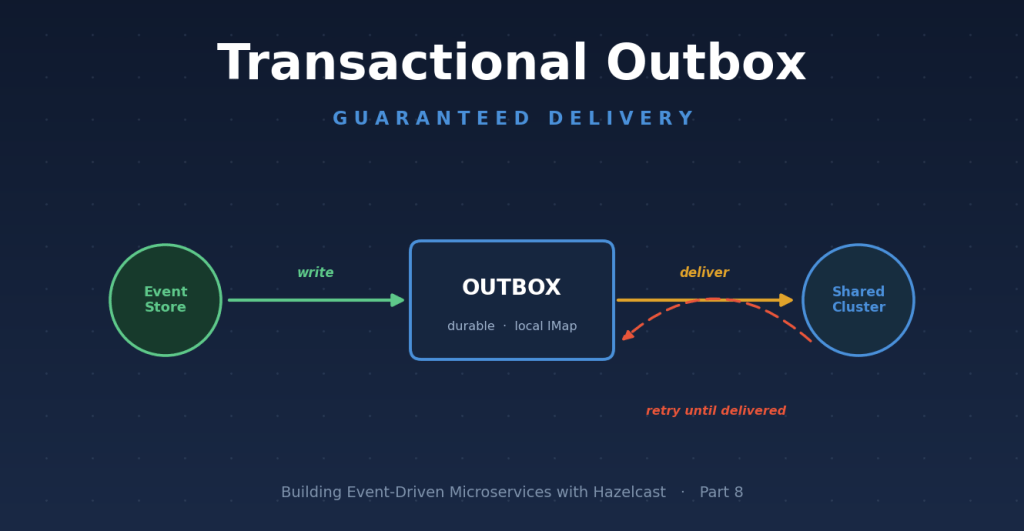
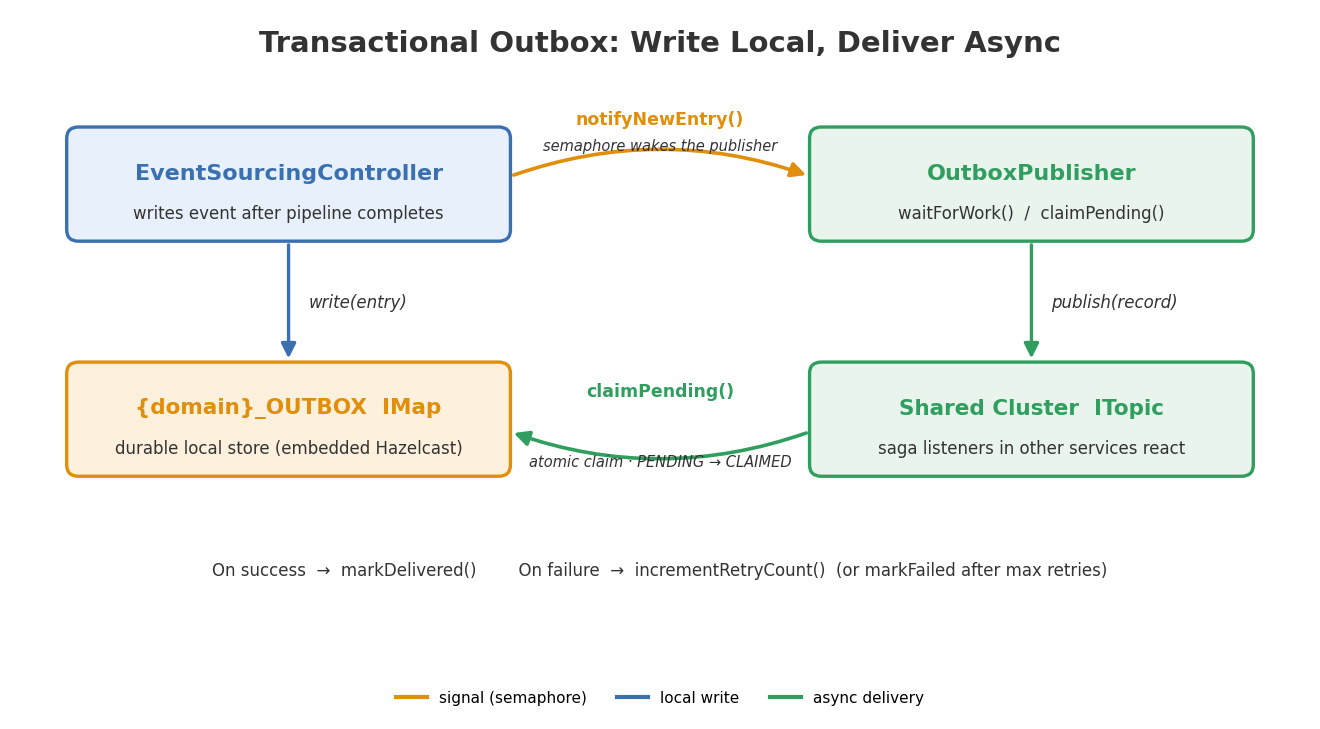
The Transactional Outbox Pattern fixes this. Instead of publishing directly to the shared cluster, the controller writes the event to a local outbox — an IMap on the embedded Hazelcast instance — and a separate publisher component picks it up and delivers it. If delivery fails, the entry stays in the outbox and gets retried.
Why Direct Publishing Fails
The problem is fundamental. Publishing to an external system (the shared cluster) and completing a local operation (the Jet pipeline) are two separate operations that can’t be made atomic.
The event is safely stored in the local event store and materialized view, but the cross-service notification is lost. You could retry in place, but that blocks the Jet pipeline for all events. You could schedule an async retry, but if the process restarts, that retry state is gone too.
The outbox pattern trades immediate delivery for guaranteed delivery. Write to a durable local store, deliver asynchronously, retry until it works. It’s the standard solution in event-driven architectures for good reason.
Architecture
The outbox IMap lives on the embedded Hazelcast instance — the same instance that hosts the event store and materialized views. Writing to it is a local operation. If the embedded instance is up (and it must be, since the pipeline just ran), the outbox write succeeds.
The OutboxEntry
Each outbox entry captures everything needed to deliver the event later:
public class OutboxEntry {

    private String eventId;          // Matches the domain event's eventId
    private String eventType;        // ITopic name (e.g., "OrderCreated")
    private GenericRecord eventRecord; // The serialized event to publish
    private int retryCount;          // Delivery attempts so far
    private Status status;           // PENDING, DELIVERED, or FAILED
    private Instant createdAt;       // When the entry was created
    private Instant lastAttemptAt;   // When the last delivery attempt occurred
    private String failureReason;    // Most recent failure message

    public enum Status {
        PENDING,    // Awaiting delivery
        DELIVERED,  // Successfully published to shared cluster
        FAILED      // Permanently failed after max retries
    }
}
The eventRecord field is the full GenericRecord that needs to go to the shared cluster’s ITopic — same record the Jet pipeline produces, complete with saga metadata like sagaId and correlationId.
Provider-agnostic. The Hazelcast implementation uses an IMap, but the interface could just as easily sit in front of a database table.
HazelcastOutboxStore
The Hazelcast implementation stores entries as Compact-serialized GenericRecord values in an IMap:
public class HazelcastOutboxStore implements OutboxStore {

    private static final String SCHEMA_NAME = "OutboxEntry";
    private final IMap<String, GenericRecord> outboxMap;

    public HazelcastOutboxStore(HazelcastInstance hazelcast, MeterRegistry meterRegistry) {
        this.outboxMap = hazelcast.getMap(DEFAULT_MAP_NAME);
    }
}
You might wonder why we’re using GenericRecord instead of storing OutboxEntry Java objects directly. The problem is that OutboxEntry has an Instant field and a nested GenericRecord — neither of which Hazelcast’s zero-config Compact serialization can handle. We’d need a custom CompactSerializer registered on every Hazelcast instance configuration. Instead, we convert at the boundary:
A few things going on here. Instant becomes int64 epoch millis — compact, sortable, unambiguous. lastAttemptAt uses setNullableInt64 because it’s null until the first delivery attempt. The nested eventRecord uses setGenericRecord, which Compact handles natively. And status is stored as the enum name string, which makes it readable in Management Center and queryable with Predicates.equal().
Polling uses a Hazelcast predicate to filter by status, sorted by creation time so the oldest entries are delivered first:
@Override
public List<OutboxEntry> pollPending(final int maxBatchSize) {
    final Collection<GenericRecord> pending = outboxMap.values(
            Predicates.equal("status", OutboxEntry.Status.PENDING.name()));

    return pending.stream()
            .map(HazelcastOutboxStore::fromRecord)
            .sorted(Comparator.comparing(OutboxEntry::getCreatedAt))
            .limit(maxBatchSize)
            .collect(Collectors.toList());
}
The OutboxPublisher
The publisher bridges the outbox and the shared cluster. The obvious approach is to poll on a fixed interval — once per second, say — but that adds latency we don’t need. We know exactly when a new entry arrives.
Event-Driven Wake-Up
The publisher uses a Semaphore to sleep until someone signals it:
public class OutboxPublisher {

    private final Semaphore wakeUp = new Semaphore(0);

    public void notifyNewEntry() {
        // Release at most 1 permit — avoids unbounded accumulation
        if (wakeUp.availablePermits() == 0) {
            wakeUp.release();
        }
    }

    public boolean waitForWork() {
        try {
            return wakeUp.tryAcquire(
                    properties.getPollInterval().toMillis(),
                    TimeUnit.MILLISECONDS);
        } catch (InterruptedException e) {
            Thread.currentThread().interrupt();
            return false;
        }
    }
}
When the EventSourcingController writes an outbox entry, it calls notifyNewEntry() right after. The publisher wakes up, claims all pending entries, delivers them. Under normal conditions, the time from event creation to shared-cluster delivery is sub-millisecond.
The poll interval (default 1 second) is the safety net. If a signal gets missed — maybe the publisher was busy with a previous batch — the timeout ensures nothing sits around for too long.
This is a JVM-local semaphore, not a distributed one. That’s fine. When the service scales to multiple replicas with per-service clustering (ADR 013), each replica has its own publisher. The semaphore wakes the local publisher instantly for locally-written events. Events written by other replicas get picked up within the poll interval. The actual coordination — preventing two replicas from delivering the same event — happens in claimPending() via an atomic ClaimEntryProcessor on the IMap.
Note claimPending rather than pollPending. The claiming mechanism uses an EntryProcessor to atomically transition entries from PENDING to CLAIMED, tagging them with the claiming member’s UUID. This prevents two publisher instances from delivering the same event — important once you’re running multiple replicas.
When no shared cluster is configured (single-node dev mode), the publisher logs one warning and stops trying. Events pile up as PENDING in the outbox. They’ll drain as soon as a shared cluster appears.
Once marked FAILED, the entry stops showing up in claim results. The failure reason is preserved for debugging.
Scheduling
OutboxAutoConfiguration hooks the publisher into Spring’s task scheduler:
@EnableScheduling
public class OutboxAutoConfiguration implements SchedulingConfigurer {

    @Override
    public void configureTasks(ScheduledTaskRegistrar taskRegistrar) {
        taskRegistrar.addFixedDelayTask(() -> {
            outboxPublisher.waitForWork();       // blocks until signaled or timeout
            outboxPublisher.publishPendingEntries();
        }, 1);  // 1ms loop delay — actual timing controlled by semaphore
    }
}
The 1ms fixed delay means the loop restarts almost immediately after each cycle, but waitForWork() controls the actual pacing. The thread blocks on the semaphore until either a permit is released or the poll interval elapses. Near-instant delivery under normal load, guaranteed pickup if a signal is missed.
Integration with EventSourcingController
The controller’s republishToSharedCluster now checks for an outbox store first:
Fully backward compatible. When outboxStore is injected, events go through the durable path. When it’s null, you get the old fire-and-forget behavior. The OutboxStore is wired through each service’s config as an optional dependency:
The outbox provides at-least-once delivery. If the publisher crashes after publishing to the ITopic but before calling markDelivered(), the next cycle picks up the same entry and delivers it again. Events are never lost as long as the embedded Hazelcast instance’s IMap data is intact.
At-least-once means consumers may see duplicates. That’s where the Idempotency Guard from Part 9 comes in — it deduplicates on the consumer side, complementing the outbox’s guaranteed delivery.
As for ordering: events for the same aggregate are written to the outbox in sequence order (the Jet pipeline processes them sequentially), and claimPending sorts by createdAt. But if two events are pending simultaneously and the first one fails while the second succeeds, they’ll arrive out of order. For our saga use case that’s acceptable — each step is identified by sagaId and eventType, and the saga state machine handles duplicates and out-of-order delivery.
Configuration
framework.outbox.*
Property
Default
Description
enabled
true
Master toggle for the outbox pattern
poll-interval
1000 (ms)
Fallback interval if signal is missed
max-batch-size
50
Maximum entries per poll cycle
max-retries
5
Delivery attempts before permanent failure
entry-ttl
24h
How long DELIVERED entries survive in the map
Metrics
Metric
Type
Description
outbox.entries.written
Counter
Events written to the outbox
outbox.entries.delivered
Counter
Events delivered to shared cluster
outbox.entries.failed
Counter
Events permanently failed
outbox.publish.duration
Timer
Time per publish cycle
To disable the outbox and use direct publishing:
framework:
  outbox:
    enabled: false
What’s Next
The outbox guarantees events reach the shared cluster. But what happens when they get there and the consumer can’t process them? The consumer might crash, the business logic might throw, the circuit breaker might be open.
In Part 9, we add two patterns that work together: a Dead Letter Queue that captures events that fail consumer-side processing, and an Idempotency Guard that prevents duplicate processing — the natural flip side of at-least-once delivery.
Part 2 in the “Building Event-Driven Microservices with Hazelcast” series
Introduction
In Part 1 we talked about event sourcing — what it is, why it matters, and how events flow through our framework. What we didn’t talk much about is the thing that actually makes the events flow: the Hazelcast Jet pipeline sitting in the middle of everything.
Jet is Hazelcast’s stream processing engine, and it’s doing all the heavy lifting here. It reads events as they arrive, pushes them through six processing stages — persist, update view, publish, and so on — and it does this with backpressure handling and sub-millisecond latency because everything stays in-memory. No external message broker. No separate stream processor. Jet is embedded right in Hazelcast, which means your event processing pipeline has direct, local access to the same IMaps that store your events and views.
Let’s walk through how it works.
The 6-Stage Pipeline
Six stages, each with one task. An event enters on the left and comes out the other side persisted, applied to a view, published to subscribers, and marked complete. If any stage fails, the context carries that information forward so downstream stages can react (usually by skipping).
Stage 1: Source — Reading from Event Journal
The pipeline reads events from the pending events IMap, but not by polling it. That would be terrible — you’d burn CPU checking for new entries, you’d introduce latency, and you’d probably miss things under load. Instead, we use the Event Journal.
The Event Journal is a ring buffer that Hazelcast maintains on each IMap. Every write to the map is recorded in the journal, and Jet can stream directly from it. You configure it on the map:
Config config = new Config();
config.getMapConfig("Customer_PENDING")
    .getEventJournalConfig()
    .setEnabled(true)
    .setCapacity(10000);
START_FROM_OLDEST means after a restart the pipeline picks up from the beginning of the journal — no events lost. withIngestionTimestamps() stamps each event as it enters the pipeline, which we use later for latency tracking.
PartitionedSequenceKey: Why the Map Key Isn’t a Simple String
You probably noticed the key type is PartitionedSequenceKey<K> rather than, say, a customer ID. There’s a reason for that, and it took us a bit to figure out we needed it.
Jet guarantees that events within the same Hazelcast partition are processed in order. Events across different partitions? No ordering guarantee. They can arrive in any order.
That’s fine as long as all events for a given entity share the same key. But consider this: you create an account keyed by customer ID, then immediately deposit funds into it keyed by transaction ID. Those two keys might hash to different partitions. Jet could process the deposit before the account exists. The deposit fails. The customer calls support. Nobody’s having a good day.
PartitionedSequenceKey separates two concerns that are easy to conflate — the event’s unique identity and the partition it should land on:
public class PartitionedSequenceKey<K>
        implements PartitionAware<K>, Comparable<PartitionedSequenceKey<K>>,
                   Serializable {

    private final long sequence;     // Globally unique FlakeId for ordering
    private final K partitionKey;    // Domain object ID for co-location

    @Override
    public K getPartitionKey() {
        return partitionKey;  // Hazelcast routes by this, not the full key
    }
}
The sequence comes from Hazelcast’s FlakeIdGenerator — globally unique, monotonically increasing. The partitionKey is the domain object’s ID (customer ID, not transaction ID). Because the key implements PartitionAware, Hazelcast uses getPartitionKey() for partition assignment instead of hashing the whole composite key. So the account creation and the deposit both route to the customer’s partition, and Jet processes them in sequence order.
Why This Is Lock-Free
There’s something worth understanding about why partition-aware routing gives us ordered, atomic processing — and it’s not locking.
Hazelcast distributes data across 271 partitions (by default), and each partition is owned by exactly one thread — the partition thread. All operations on keys in that partition are executed by that single thread, sequentially. There’s no concurrent access to fight over, so there’s no need for locks, CAS operations, or synchronized blocks. Two events for customer-123 arrive a millisecond apart? They both route to the same partition, and the partition thread processes them one after the other. Ordering and atomicity come from the threading architecture itself.
This carries through to the materialized view layer too. When we call executeOnKey with an EntryProcessor in Part 3, that processor runs on the partition thread for that key. It reads the current state, applies the event, writes the new state — all in one shot, on one thread, with no possibility of a conflicting update sneaking in between. It’s atomic by construction, not by locking.
The practical payoff is concurrency without contention. Thousands of events per second can flow through the pipeline, and as long as they’re for different entities, they’re processed in parallel across different partition threads. Events for the same entity are serialized — but by the architecture, not by a bottleneck. You get high throughput and strict per-entity ordering at the same time, and you didn’t write a single line of synchronization code to get it.
Stage 2: Enrich — Adding Metadata
Before we do anything with the event, we stamp it with pipeline entry time and extract identification fields. This gives us latency tracking from the moment the event enters the pipeline, not just from when it was created.
(Note the static method — that’s not accidental. We’ll come back to why in the architecture section.)
The EventContext is the envelope that carries the event through all remaining stages:
private static class EventContext<K> implements Serializable {

    final PartitionedSequenceKey<K> key;
    final GenericRecord eventRecord;
    final String eventType;
    final String eventId;
    final Instant pipelineEntryTime;

    // Stage completion flags
    boolean persisted;
    boolean viewUpdated;
    boolean published;

    // Stage timing
    Instant persistTime;
    Instant viewUpdateTime;
    Instant publishTime;
}
Each stage sets its own flag and timestamp. If persist fails, persisted stays false, and the view update stage sees that and skips. No event gets partially applied without the context knowing about it.
Stage 3: Persist — Writing to the Event Store
This is the durability step. Once an event is in the event store, it’s the permanent record of what happened. Everything else — views, notifications, completions — can be rebuilt from events. This one can’t.
Why the ServiceFactory indirection instead of just passing in an EventStore reference? Because Jet pipelines are distributed. The pipeline definition gets serialized and shipped to whatever nodes Jet decides to run it on. If your lambda captures a reference to a Spring-managed EventStore bean — which holds a HazelcastInstance, database connections, and who knows what else — that serialization is going to fail spectacularly at runtime.
ServiceFactory solves this: you give Jet a recipe for creating the service, and it creates an instance on each node where the pipeline actually runs.
public class EventStoreServiceCreator<D extends DomainObject<K>, K,
        E extends DomainEvent<D, K>>
        implements FunctionEx<ProcessorSupplier.Context, HazelcastEventStore<D, K, E>> {

    private final String domainName;

    @Override
    public HazelcastEventStore<D, K, E> applyEx(ProcessorSupplier.Context ctx) {
        HazelcastInstance hz = ctx.hazelcastInstance();
        return new HazelcastEventStore<>(hz, domainName);
    }
}
The creator itself is just a domain name string — easily serializable. The heavy objects get created on the target node using that node’s local HazelcastInstance.
Stage 4: Update View — Applying to Materialized View
With the event persisted, we update the materialized view. This is where the event’s apply logic runs — transforming the event into current state.
Returning null from applyEvent is the deletion convention — the updater removes the entry from the view. Everything else either creates or modifies the view record.
Stage 5: Publish — Notifying Other Services via ITopic
Once the view is updated, we publish the event so other services can react. This is where cross-service communication happens. Saga listeners subscribe to topics like “OrderCreated” or “StockReserved” and kick off their own workflows when those events arrive.
The TopicPublisher is thin — it resolves the ITopic by event type name and publishes:
public class EventTopicPublisherServiceCreator
        implements FunctionEx<ProcessorSupplier.Context, TopicPublisher> {

    @Override
    public TopicPublisher applyEx(ProcessorSupplier.Context ctx) {
        return new TopicPublisher(ctx.hazelcastInstance());
    }

    public static class TopicPublisher {
        private final HazelcastInstance hazelcast;

        public void publish(String topicName, GenericRecord record) {
            ITopic<GenericRecord> topic = hazelcast.getTopic(topicName);
            topic.publish(record);
        }
    }
}
Each event type gets its own ITopic. The Order service subscribes to StockReserved and PaymentProcessed; the Inventory service subscribes to OrderPlaced. Nobody hears events they can’t act on.
Stage 6: Complete — Signaling Completion (and Smuggling Out Metrics)
The last stage writes a completion record so the calling code knows the event made it through. But there’s a twist.
Jet pipelines run inside Hazelcast’s execution engine. They don’t have access to Spring’s MeterRegistry, or any external metrics system. The pipeline can time every stage internally — it does, that’s what all those Instant.now() calls are for — but it has no way to report those timings to Prometheus or Grafana directly.
So we cheat. The completion record carries the timestamps out:
The controller picks up the completion, extracts the timestamps, and reports them to Micrometer. The pipeline instruments itself; the controller publishes the metrics. It also gets the stage success flags — persisted, viewUpdated, published — so it knows whether the event made it through clean or had partial failures along the way.
The controller side looks like this:
public CompletableFuture<EventCompletion> handleEvent(DomainEvent event, UUID correlationId) {
    pendingEventsMap.set(key, eventRecord);

    return CompletableFuture.supplyAsync(() -> {
        int maxWait = 5000;
        int elapsed = 0;

        while (elapsed < maxWait) {
            GenericRecord completion = completionsMap.get(key);
            if (completion != null) {
                return EventCompletion.success(eventId);
            }
            Thread.sleep(10);
            elapsed += 10;
        }
        throw new TimeoutException("Event processing timeout");
    });
}
Write the event to the pending map, then poll the completions map until the pipeline writes the result. Five seconds is plenty — the pipeline usually finishes in under a millisecond.
Jet Pipeline Traps (and How We Avoid Them)
If you’re used to writing normal Java code, Jet pipelines will surprise you in a few unpleasant ways. These are the ones that cost us the most time.
The Serialization Trap
Every lambda in the pipeline must be serializable, because Jet ships the pipeline definition to whichever nodes it decides to run on. If your lambda captures this, and this has a HazelcastInstance field, or a Spring ApplicationContext, or anything else that doesn’t serialize — you get a NotSerializableException at runtime. Not at compile time. At runtime. In production, ideally on a Friday.
Three rules keep you out of trouble:
Use static methods as pipeline stages (they don’t capture this). Use ServiceFactory for anything that needs a Hazelcast instance or other heavy resource. And if you must capture a value, make sure it’s a final local variable that’s actually serializable.
// This will ruin your weekend
.map(event -> this.eventStore.append(event))

// This will not
.mapUsingService(eventStoreFactory, (store, event) -> store.append(event))
The Try-Catch That Catches Nothing
This one’s sneaky. Your instinct when writing the pipeline is to wrap the whole thing in a try-catch:
try {
    Pipeline pipeline = Pipeline.create();
    // ... define all six stages ...
    hazelcast.getJet().newJob(pipeline, jobConfig);
} catch (Exception e) {
    logger.error("Pipeline failed!", e);  // This catches almost nothing useful
}
That try-catch protects you during pipeline assembly — if you misspell a map name or pass an invalid config, you’ll catch it. But assembly isn’t where things go wrong. Things go wrong during execution, and by that point your code is somewhere else entirely.
When you call newJob(), Jet takes your pipeline definition, converts each stage into a processor, and distributes those processors across the cluster. The actual event processing happens inside those distributed processors, on whichever nodes Jet assigned them to. You’re not just off the end of that try-catch block — you might not even be on the same machine.
That’s why every stage in our pipeline has its own try-catch inside the lambda:
The error handling has to live where the code actually runs — inside each processor, on whatever node Jet put it on. Downstream stages check the context flags before doing work. If persist failed, the view update skips. If the view update failed, publish skips. The completion record captures exactly what happened, so you can diagnose partial failures from the metrics.
Cooperative, Non-Cooperative, Shared, and Non-Shared
Jet services have two dimensions you need to get right, and they’re independent of each other.
Cooperative vs. non-cooperative is about blocking. Jet’s default threading model is cooperative — stages share a thread pool and are expected to yield quickly. If a stage does I/O (writes to the event store, makes a network call, publishes to ITopic), it blocks the thread. Mark it non-cooperative so Jet gives it a dedicated thread:
Forget this and your pipeline stalls under load. The cooperative thread pool gets monopolized by I/O-bound stages that never yield, and throughput craters.
Shared vs. non-shared is about thread safety. A shared service creates one instance per node and hands it to all processors on that node — multiple threads will call it concurrently. A non-shared service creates a separate instance for each processor, so no concurrent access.
Our EventStore and TopicPublisher are backed by Hazelcast data structures (IMap, ITopic), which are thread-safe, so they’re shared. But if you had a service that accumulated state in a local buffer, or maintained a non-thread-safe connection like a raw JDBC Connection, you’d mark it non-shared:
// Thread-safe service — one instance shared across processors on this node
ServiceFactories.sharedService(creator).toNonCooperative();

// NOT thread-safe — each processor gets its own instance
ServiceFactories.nonSharedService(creator).toNonCooperative();
Get the combination wrong and you get either unnecessary memory overhead (non-shared when shared would do) or, worse, data corruption from concurrent access to a non-thread-safe service (shared when it shouldn’t be). That second one is the kind of bug that shows up intermittently under load and makes you question your career choices.
Lifecycle Management
Starting and stopping the pipeline:
public class EventSourcingPipeline<D, K, E> {

    private volatile Job pipelineJob;

    public Job start() {
        if (pipelineJob != null && !pipelineJob.isUserCancelled()) {
            logger.warn("Pipeline already running");
            return pipelineJob;
        }

        Pipeline pipeline = buildPipeline();
        JobConfig jobConfig = new JobConfig()
            .setName(domainName + "-EventSourcingPipeline");

        pipelineJob = hazelcast.getJet().newJob(pipeline, jobConfig);
        logger.info("Started pipeline for {}, jobId: {}",
            domainName, pipelineJob.getId());
        return pipelineJob;
    }

    public void stop() {
        if (pipelineJob != null) {
            pipelineJob.cancel();
            logger.info("Stopped pipeline for {}", domainName);
        }
    }
}
Each domain (Customer, Order, Inventory) gets its own pipeline instance running as a Jet job. They’re independent — you can restart the Order pipeline without affecting Customers.
Performance
All of this runs on a single Apple MacBook Pro (M4, 16GB) with three Hazelcast instances in Docker Compose:
Metric
Value
Throughput
100,000+ events/sec
P50 Latency
< 0.3ms
P99 Latency
< 1ms
P99.9 Latency
< 5ms
That’s the materialized view layer — events flowing through the pipeline and out the other side. It’s fast because everything is in-memory, Jet parallelizes across partitions, the Event Journal provides non-blocking streaming, and views and events live on the same cluster (no network hop for the view update).
We verify it with a load test that submits 100K events and waits for all completions:
// Load test
@Test
void loadTest_100KEvents() {
    int eventCount = 100_000;
    List<CompletableFuture<?>> futures = new ArrayList<>();
    long start = System.nanoTime();

    for (int i = 0; i < eventCount; i++) {
        CustomerCreatedEvent event = createTestEvent(i);
        futures.add(controller.handleEvent(event, UUID.randomUUID()));
    }

    CompletableFuture.allOf(futures.toArray(new CompletableFuture[0])).join();

    long duration = System.nanoTime() - start;
    double tps = eventCount / (duration / 1_000_000_000.0);
    System.out.printf("Processed %d events in %dms (%.0f TPS)%n",
        eventCount, duration / 1_000_000, tps);
}
Monitoring
The pipeline metrics — events processed, processing time histograms, pending event counts — feed into Micrometer and from there to Prometheus and Grafana. We’ll dig into the observability setup in a later post, but here’s the shape of it:
public class PipelineMetrics {

    private final Counter eventsProcessed;
    private final Timer eventProcessingTime;

    public PipelineMetrics(MeterRegistry registry, String domainName) {
        this.eventsProcessed = Counter.builder("events.processed")
            .tag("domain", domainName)
            .register(registry);

        this.eventProcessingTime = Timer.builder("events.processing.time")
            .tag("domain", domainName)
            .register(registry);
    }
}
Remember how Stage 6 smuggles timing data out in the completion record? This is where it ends up — the controller reads the timestamps, calculates durations, and records them here.
That’s the pipeline. Six stages, each with one task, connected by an EventContext that carries the event and its processing history all the way through. The design decisions that matter most: PartitionedSequenceKey for ordering, ServiceFactory for distributed service access, static methods to dodge serialization traps, and a completion record that doubles as a metrics transport.
Next up we’ll look at what happens after Stage 4 in more detail — how materialized views are designed, queried, and rebuilt.
Part 1 in the “Building Event-Driven Microservices with Hazelcast” series
Introduction
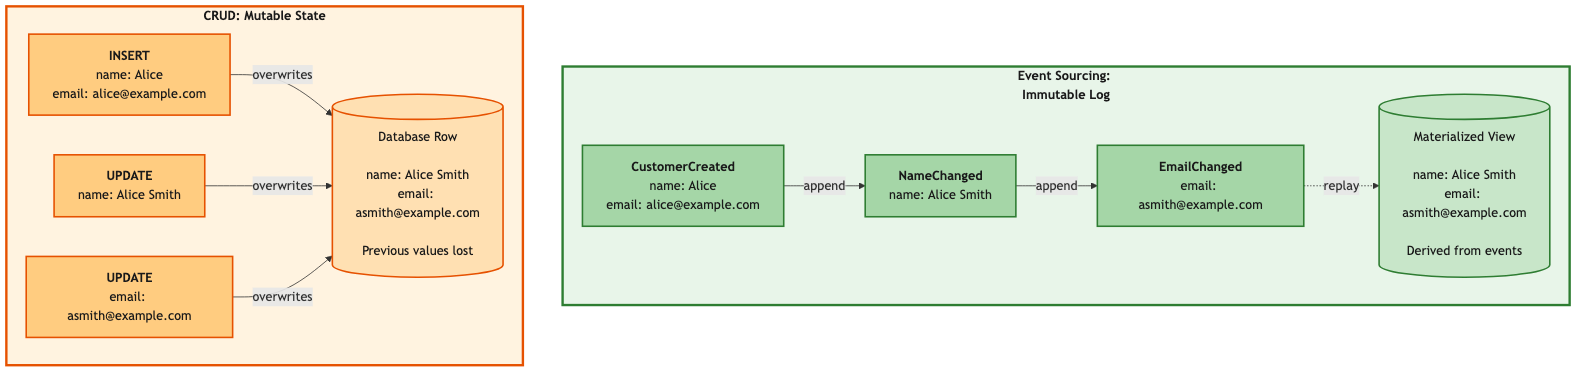
Here’s something that should bother you more than it probably does: every time you run an UPDATE statement against a database, you’re destroying information.
UPDATE customers SET address = '456 Oak Ave' WHERE id = 'cust-123';
That customer used to live at 123 Main St. Now they don’t. And you have no idea that 123 Main St ever existed, because you just overwrote it. The old address is gone. The audit trail is gone. If someone asks “where did this customer live six months ago?” you shrug and check if maybe somebody logged it somewhere.
We’ve been building systems like this for decades, and honestly, it mostly works. Until it doesn’t. Until you need to debug a production issue and you can’t figure out what sequence of changes got the system into this state. Until compliance asks for a history of every change to customer PII. Until Service A goes down and takes Services B, C, and D with it because they all need to call A synchronously to get data they should already have.
Event sourcing flips this model. Instead of storing current state, you store the sequence of events that produced it. The current state becomes something you derive — a view that you can rebuild from events at any time.
In this post, we’ll look at how to implement event sourcing with Hazelcast, which turns out to be a remarkably good fit for this pattern. Fast writes for the event stream, real-time processing with Jet pipelines, and sub-millisecond reads from materialized views — it’s basically the whole event sourcing infrastructure in one platform.
What is Event Sourcing?
The core idea is simple enough to state in three lines:
Every state change is captured as an immutable event
Current state is computed by replaying those events
The complete history is preserved forever
That third point is the one that makes people nervous. “Forever? Really? Every event?” Yes. That’s the deal. And it turns out to be the source of most of the pattern’s power.
A Quick Example
Take that customer we just destroyed with an UPDATE. In event sourcing, there is no UPDATE. There are only events:
The current address is still 456 Oak Ave. But the old address is still there in Event 1. Nothing was overwritten. Nothing was lost. You can reconstruct the customer’s state at any point in time by replaying events up to that moment.
Why Event Sourcing?
I get it — the first time you encounter event sourcing, the reaction is usually something like “you want me to store every event forever instead of just updating a row? That sounds like a lot more work.” And honestly, it does feel unfamiliar, and unfamiliar feels like ick. You need a compelling reason to push past that.
There are several.
Microservices Need Decoupling, and Events Actually Deliver It
The whole pitch for microservices is services that can be developed, deployed, and scaled independently. Beautiful theory. In practice, the independence evaporates the moment one service makes a synchronous REST call to another to get data it needs.
Think about it. The Account service goes down — does the Order service go down with it? If Order is making HTTP calls to Account to look up customer names, then yes. Probably yes. You’ve built yourself a distributed monolith: all the operational complexity of microservices with none of the resilience benefits. Congratulations.
Event sourcing solves this at an architectural level, not with duct tape. When a customer is created, the Account service publishes a CustomerCreatedEvent. The Order service subscribes to those events and builds its own local materialized view of customer data. No HTTP call. No dependency on Account being up. No shared database.
If Account goes down for maintenance on a Tuesday afternoon, Order keeps running. It already has the customer data it needs. The services are actually decoupled — not just deployed to separate containers while secretly depending on each other for every request.
Events Capture What Actually Happened
Here’s a distinction that seems pedantic until it saves you during a production incident. A database transaction log records what changed:
UPDATE customers SET address = '456 Oak Ave' WHERE id = 'cust-123';
A domain event records what happened in business terms:
CustomerMovedEvent { customerId: 'cust-123', previousAddress: '123 Main St',
                     newAddress: '456 Oak Ave', reason: 'RELOCATION' }
The transaction log tells you a column changed. The domain event tells you a customer moved, where they moved from, and why. That business context gets captured once, at the moment it happens, and it’s preserved forever.
When someone asks “why did this order ship to the wrong address?” you can trace the exact sequence: here’s when the customer moved, here’s the order that was placed two hours before the address change propagated, here’s why the old address was used. With CRUD, you’d be spelunking through application logs and hoping somebody thought to log the right thing.
Event Streams Are AI-Ready Data
This one has been sneaking up on us.
An event-sourced system doesn’t just store what the world looks like right now. It stores how it got there — a sequence of business actions, ordered in time, with context attached. That turns out to be exactly the kind of data that AI systems are hungry for.
Look at what an AI agent sees when it queries a traditional database: customer has address X, has ordered Y items, has a balance of Z. A flat snapshot. Static. Not much to work with beyond simple lookups.
Now look at what it sees in an event stream:
CustomerCreatedEvent        → new customer in Seattle
ProductViewedEvent (×12)    → browsed camping gear heavily
CartUpdatedEvent (×4)       → added/removed items, compared prices
OrderPlacedEvent            → bought mid-range tent, not the premium one
CustomerMovedEvent          → relocated to Denver
ProductViewedEvent (×8)     → browsing ski equipment
That’s a behavioral narrative. Purchase hesitation patterns. Geographic lifestyle shifts. Seasonal interest changes. None of that exists in a snapshot of current state.
Now, I should be honest here — databases have transaction logs, and you can do analytics on those. But transaction logs record row-level mutations: SET column = value. Domain events record business actions with semantic meaning. The difference is the difference between “field changed” and “customer moved to Denver and started shopping for ski gear.” One is plumbing. The other is insight.
Why Hazelcast?
So you’re sold on event sourcing (or at least willing to keep reading). Why Hazelcast as the platform?
Because event sourcing needs three things to work well, and Hazelcast handles all of them:
Fast writes for the event stream. Events go into an IMap — in-memory, sub-millisecond. You’re not waiting for a disk flush on the critical path.
Real-time processing. Hazelcast’s Event Journal streams events to Jet pipelines as they arrive. No polling, no batch windows. Events flow through processing stages — persist to event store, update materialized view, publish to subscribers — as a continuous pipeline.
Fast reads from materialized views. Once the pipeline updates a view, queries against it are sub-millisecond IMap lookups. No joins, no aggregation at query time.
Add ITopic for pub/sub event distribution across services and native horizontal scaling across cluster nodes, and you’ve got a complete event sourcing infrastructure without bolting together five different technologies.
Core Concepts
Domain Events
A domain event represents something meaningful that happened in your business. In our framework, events extend DomainEvent:
public abstract class DomainEvent<D extends DomainObject<K>, K>
        implements UnaryOperator<GenericRecord>, Serializable {

    // Event identification
    protected String eventId;        // Unique ID (UUID)
    protected String eventType;      // e.g., "CustomerCreated"
    protected String eventVersion;   // For schema evolution

    // Event metadata
    protected String source;         // Service that created it
    protected Instant timestamp;     // When it happened

    // Domain object reference
    protected K key;                 // Key of affected entity

    // Traceability
    protected String correlationId;  // Links related events

    // The key method: how does this event change state?
    public abstract GenericRecord apply(GenericRecord currentState);
}
The apply() method is the interesting part — it defines how this event transforms current state into new state. Each event type implements its own version of this, which means the logic for “what does this event do?” lives with the event itself, not in some giant switch statement somewhere.
If you’ve spent time with Domain-Driven Design, you’ll notice that our DomainObject<K> is what DDD calls an aggregate root. Every event is scoped to exactly one aggregate — CustomerCreatedEvent belongs to the Customer aggregate, OrderPlacedEvent belongs to the Order aggregate. Consistency is enforced within the aggregate boundary: all events for a given customer are ordered and processed sequentially (we’ll see how Hazelcast’s partition threading makes this work in Part 2). Across aggregates — between a customer and an order, say — we accept eventual consistency and coordinate through sagas. We don’t go deep into DDD vocabulary in this series, but if you know the terminology, you’ll see the boundaries everywhere.
A Concrete Example
Here’s CustomerCreatedEvent from our eCommerce implementation:
public class CustomerCreatedEvent extends DomainEvent<Customer, String> {

    public static final String EVENT_TYPE = "CustomerCreated";

    private String email;
    private String name;
    private String address;
    private String phone;

    public CustomerCreatedEvent(String customerId, String email,
                                 String name, String address) {
        super(customerId);  // Sets the key
        this.eventType = EVENT_TYPE;
        this.email = email;
        this.name = name;
        this.address = address;
    }

    @Override
    public GenericRecord apply(GenericRecord currentState) {
        // For creation events, ignore current state and create new
        return GenericRecordBuilder.compact("Customer")
            .setString("customerId", key)
            .setString("email", email)
            .setString("name", name)
            .setString("address", address)
            .setString("status", "ACTIVE")
            .setInt64("createdAt", Instant.now().toEpochMilli())
            .build();
    }
}
Notice that apply() for a creation event ignores currentState entirely — there is no current state, we’re creating it. Update events would read from currentState and modify specific fields.
The Event Store
The event store is append-only. Events go in and they don’t come out (well, they come out for reads, but they’re never modified or deleted). It’s the permanent, immutable record of everything that happened.
public interface EventStore<D extends DomainObject<K>, K,
                            E extends DomainEvent<D, K>> {

    void append(K key, GenericRecord eventRecord);

    List<GenericRecord> getEventsForKey(K key);

    void replayByKey(K key, Consumer<GenericRecord> eventConsumer);

    long getEventCount();
}
Materialized Views
If events are the source of truth, how do you actually query current state without replaying the entire event history every time someone calls GET /customers/123? You don’t. You maintain materialized views.
A materialized view is a pre-computed projection — it gets updated incrementally as each event flows through the pipeline. Think of it as a cache that’s always consistent with the event stream, because it’s derived from it.
The view always reflects the latest state. Reads are instant — it’s just an IMap lookup.
The Event Flow
Here’s the full lifecycle of an event in our framework:
A REST request comes in. The service creates an event and drops it into the pending events IMap. The Jet pipeline picks it up via the Event Journal, then processes it through four stages: persist to the event store, update the materialized view, publish to subscribers via ITopic, and write a completion record. The API returns the customer data from the now-updated view.
That’s eight steps for what CRUD does in one database write. And yeah, that’s more moving parts. But each of those parts is doing something valuable — you get an audit trail, a materialized view, cross-service notification, and async completion tracking, all from a single event submission.
The Service Layer
Here’s what it looks like from the service code’s perspective:
@Service
public class AccountService {

    private final EventSourcingController<Customer, String,
                    DomainEvent<Customer, String>> controller;

    public CompletableFuture<Customer> createCustomer(CustomerDTO dto) {
        CustomerCreatedEvent event = new CustomerCreatedEvent(
            UUID.randomUUID().toString(),
            dto.getEmail(),
            dto.getName(),
            dto.getAddress()
        );

        UUID correlationId = UUID.randomUUID();
        return controller.handleEvent(event, correlationId)
            .thenApply(completion -> {
                return getCustomer(event.getKey()).orElseThrow();
            });
    }

    public Optional<Customer> getCustomer(String customerId) {
        GenericRecord gr = controller.getViewMap().get(customerId);
        if (gr == null) return Optional.empty();
        return Optional.of(Customer.fromGenericRecord(gr));
    }
}
The service creates an event, not a database record. handleEvent() returns a CompletableFuture that completes when the pipeline has processed the event all the way through. And reads come from the materialized view — no event replay, just a fast IMap lookup.
Benefits in Practice
The architectural arguments are nice, but let’s see what this actually looks like when you’re debugging at 2am or fielding a compliance request.
Audit Trail
Every change is recorded. Every single one.
List<GenericRecord> history = eventStore.getEventsForKey("cust-123");
for (GenericRecord event : history) {
    System.out.println(event.getString("eventType") + " at " +
                       event.getInt64("timestamp"));
}
CustomerCreated at 1706374800000
CustomerUpdated at 1706375100000
CustomerAddressChanged at 1706461200000
No special audit logging framework. No triggers on database tables. The event store is the audit trail, because it’s the source of truth.
Time Travel
Need to see what the data looked like last Thursday?
GenericRecord pastState = null;
for (GenericRecord event : eventStore.getEventsForKey("cust-123")) {
    if (event.getInt64("timestamp") > targetTime) break;
    pastState = applyEvent(event, pastState);
}
Replay events up to the timestamp you care about and stop. You now have the exact state of that entity at that moment. Try doing that with a database that only stores current state.
View Rebuilding
Found a bug in your view update logic? Fix the code and rebuild:
viewUpdater.rebuild(eventStore);
Clear the view, replay all events through the corrected logic, done. With CRUD, if your update logic had a bug that corrupted data, that data is just… corrupted. The correct values are gone. You’re restoring from backups and hoping for the best.
Service Independence
The Order service doesn’t call Account to get customer names. It has its own materialized view built from customer events:
Each service maintains the views it needs for its own work. No cross-service calls at query time.
Performance
All the numbers here are from a single Apple MacBook Pro (M4 chip, 16GB RAM) running all services via Docker Compose. This is a baseline — the framework is designed to scale horizontally across Hazelcast cluster nodes and Kubernetes replicas, so treat these as a floor, not a ceiling.
The materialized view layer — the raw speed of IMap operations inside the JVM, bypassing HTTP entirely:
Metric
Value
View update throughput
100,000+ ops/second
P99 latency
< 1ms
View read latency
< 0.5ms
End-to-end through the full pipeline (REST → event store → Jet → view update → ITopic publish):
Metric
Value
Throughput
~300+ TPS
That end-to-end number is using curl in bash subshells as the load driver, which is about the least efficient way to generate HTTP load (every request forks a process and opens a new connection). A proper load testing tool with connection pooling — wrk, k6, Gatling — would push that number higher for the same pipeline.
What’s Next?
This was the foundation — what event sourcing is, why you’d use it, and how it works with Hazelcast. The series continues with deeper dives into the individual components:
Building the event pipeline with Hazelcast Jet
Materialized views for fast queries
Observability in event-sourced systems
The saga pattern for distributed transactions
Vector similarity search with Hazelcast
AI-powered microservices with MCP
Circuit breakers and resilience patterns
Transactional outbox and exactly-once delivery
Dead letter queues and idempotency
Performance engineering at scale
…and more as the framework evolves.
Getting Started
The complete framework is on GitHub — full source code, Docker Compose setup, a sample eCommerce application, load testing tools, and over 2,000 tests.
git clone https://github.com/myawnhc/hazelcast-microservices-framework
cd hazelcast-microservices-framework
./scripts/docker/start.sh
./scripts/load-sample-data.sh
./scripts/demo-scenarios.sh
Event sourcing asks you to shift your thinking from “store what the world looks like” to “record what happened.” It’s a different mental model, and it takes some getting used to. But the payoff — real service decoupling, a complete audit trail, time travel debugging, views you can rebuild from scratch, and an event stream that’s ready for AI to mine — makes it worth the adjustment for a lot of systems.
That’s where we’ll leave things for today.
Next up: Building the Event Pipeline with Hazelcast Jet
How a side project connecting Event Sourcing to Hazelcast sat
unfinished for years — and why I decided to bring it back with an AI
collaborator.
In my previous post, I shared some of my
thinking about Event-Driven Microservices — the coupling problems, the
mental shift toward thinking in events, and the patterns (Event
Sourcing, CQRS, materialized views) that make it all work. That post
was conceptual. This one is personal.
I’ve been playing around with design concepts in this area for some
time. While I was an employee of Hazelcast, I frequently worked with
customers and prospects to show how Hazelcast Jet — an event stream
processing engine built into the Hazelcast platform — could be used to
build event processing solutions that would scale while continuing to
provide low latency. These conversations were always framed around
stream processing, though. Even when the intended use case was around
microservices, we didn’t explicitly get into the Event Sourcing
pattern. As someone coming from a background that was
database-centric, the concept of events as the source of truth was a
bit much for me.
The Light Bulb Moment
It was a light bulb moment when I realized that Hazelcast Jet could
fit naturally into an Event Sourcing architecture — and that Hazelcast
IMDG (the in-memory data grid, or caching layer) could concurrently
maintain materialized views representing the current state of domain
objects.
Think about it: Event Sourcing needs an event log and a processing
pipeline. Hazelcast Jet is a processing pipeline. CQRS needs a fast
read-side store that’s kept in sync with the event stream. Hazelcast
IMDG is a fast read-side store. Event Sourcing + CQRS maps
beautifully onto Jet + IMDG (even though that acronym is officially
retired — it’s all just “Hazelcast” now).
And from there, I really wanted to demonstrate this. The original
Microservices Framework project began.
Version 1: The Proof of Concept
The first version was focused on proving the core idea worked. Could I
wire up a Hazelcast Jet pipeline to process domain events, persist
them to an event store, and update materialized views — all in a way
that was generic enough to work across different services?
The answer was yes. The central pattern that emerged was
straightforward: a service’s handleEvent() method writes incoming
events to a PendingEvents map, which triggers a Jet pipeline that
persists events to the EventStore, updates materialized views, and
publishes to an event bus for other services to consume. It worked,
and it was fast.
Now, the central components of the architecture — the domain object,
event class, controller, and pipeline — have survived relatively
intact through multiple iterations of the implementation. The bones
were good. But a lot of the specific implementation choices I made
around those bones haven’t aged all that well.
You know how it goes with side projects. Technical debt accumulates
quietly, one “I’ll fix this later” at a time, until you’re looking at
a codebase where you know you’d make different choices if you were
starting over — but the sunk cost of time already invested keeps you
from actually doing it. It’s the software equivalent of a kitchen
renovation where you keep patching the old cabinets because ripping
them out feels like too big a project for a weekend.
That version of the framework is still hanging around on GitHub,
although I decided not to link to it here as I may take it down at
any time. (Upcoming posts will link to the improved version, so
embedding links to the original will inevitably lead to someone
grabbing the wrong one.)
I got it to a working state, but there was a long list of things I
wanted to add. Saga patterns for coordinating multi-service
transactions. Observability dashboards. Comprehensive tests.
Documentation that went beyond “read the code.” Each of these was a
meaningful chunk of work, and progress slowed to a crawl.
The Stall
Let’s be honest about what happened: the project stalled. Not
dramatically — it wasn’t ever really abandoned. It just… stopped
moving. Every few months I’d open the codebase, when I had some extra
time, and make a few minor, inconsequential changes while thinking of
the more ambitious refactorings or added features that I’d get to when
time permitted.
If you’ve ever maintained a passion project alongside a day job, you
know this feeling. The ideas don’t go away — they sit in the back of
your mind, periodically surfacing with a pang of “I should really get
back to that.” But the activation energy to restart is high, especially
when the next step isn’t a fun new feature but the grind of
scaffolding, configuration, and test coverage. So you close the laptop
and tell yourself next month will be different. (It won’t be.)
Enter AI-Assisted Development
In early 2025, I started using Claude for various coding tasks and was
genuinely surprised by the results. This wasn’t autocomplete on
steroids — I could describe an architectural pattern and get back code
that understood the why, not just the what. I could say “this
needs to work like an event journal with replay capability” and get
something that actually accounted for ordering guarantees and
idempotency.
That’s when the thought crystallized: what if I could use this to
break through the stall?
Here’s the thing — the stuff that had been blocking me wasn’t the hard
design work. I knew what the architecture should look like. The
bottleneck was the sheer volume of implementation grind: scaffolding
new services, writing comprehensive tests, wiring up Docker
configurations, producing documentation. Exactly the kind of work
where you need focused hours, and a side project never has enough of
those.
Now, I want to be clear about what I mean here, because “AI wrote my
code” carries a lot of baggage. This wasn’t about handing off the
project and checking back in when it was done. It was about having a
collaborator who could take high-level design direction and turn it
into working code at a pace that made the project viable again. I’d
provide the domain expertise, the architectural decisions, and the
quality bar. The AI would provide the throughput.
Making the Decision
I decided to move forward with a clean reimplementation rather than
trying to evolve the existing codebase. The core patterns from the
original work — the Jet pipeline architecture, the event store design,
the materialized view update strategy — were proven and would carry
forward. But the project structure, package naming, dependency
versions, and framework abstractions would start fresh. Sometimes the
best way to fix a kitchen is to actually rip out the cabinets.
The plan was to use Claude’s desktop interface for iterative design
discussions (requirements, architecture, implementation planning) and
then hand off to Claude Code for the actual coding. Design first,
then build — with comprehensive documentation at every step so the AI
would have rich context to work from.
What happened next — the design phase, the handoff to Claude Code,
and the surprises along the way — is the subject of the
next post.