Part 12 in the “Building Event-Driven Microservices with Hazelcast” series
Over the past eleven posts, we’ve built an event sourcing framework, a Jet pipeline, materialized views, sagas, circuit breakers, an outbox, dead letter queues, and durable persistence. That’s a lot of moving parts.
Now: how do you observe what’s happening inside all of them?
Event sourcing changes the observability game. Traditional request-response applications have easy metrics — request rate, error rate, latency. In an event-sourced system, a single API call triggers an asynchronous pipeline that writes to an event store, updates a materialized view, publishes to subscribers, and potentially kicks off a multi-service saga. A latency spike could be hiding in any of those stages. You need to see into all of them.
This post builds a complete observability stack: Prometheus + Micrometer for metrics, Grafana for dashboards and alerting, Jaeger for distributed tracing.
How It Fits Together
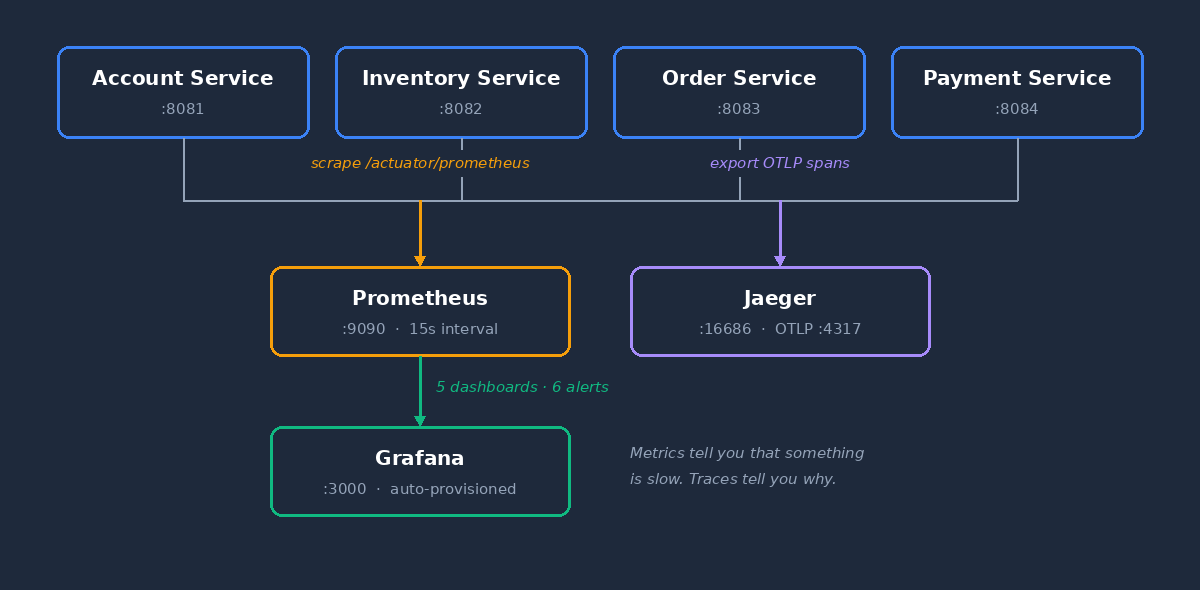
Each service exposes /actuator/prometheus. Prometheus scrapes all four every 15 seconds. Grafana reads from Prometheus and renders dashboards. Jaeger collects distributed traces via OTLP.
Instrumenting the Framework
Metrics Architecture
An event-sourced system has a lot of moving parts, and each one needs its own instrumentation. The framework provides roughly 70 metrics across a dozen categories. They’re organized around two core subsystems — the event pipeline and the saga layer — plus several supporting categories for everything else.
Pipeline Metrics
PipelineMetrics tracks every event through the 6-stage pipeline:
public class PipelineMetrics {

    private final MeterRegistry registry;
    private final String domainName;

    // Events entering and leaving the pipeline
    Counter eventsReceived;   // "eventsourcing.pipeline.events.received"
    Counter eventsProcessed;  // "eventsourcing.pipeline.events.processed"
    Counter eventsFailed;     // "eventsourcing.pipeline.events.failed"

    // End-to-end latency histogram with percentiles
    Timer endToEndLatency;    // "eventsourcing.pipeline.latency.end_to_end"
    Timer queueWaitLatency;   // "eventsourcing.pipeline.latency.queue_wait"

    // Per-stage timing
    Timer stageDuration;      // "eventsourcing.pipeline.stage.duration"
                              // Tagged with stage: persist, update_view, publish
}
Every metric is tagged with domain (e.g., “Customer”, “Order”) and eventType (e.g., “CustomerCreated”), so you can filter as narrowly as you need:
Counter.builder("eventsourcing.pipeline.events.processed")
    .tag("domain", domainName)
    .tag("eventType", eventType)
    .register(registry);
The per-stage timer is the one I find most useful for debugging. If P99 spikes, you can see which stage is the bottleneck — is it the event store write, the view update, or the publication step?
public enum PipelineStage {
    SOURCE("source"),
    ENRICH("enrich"),
    PERSIST("persist"),
    UPDATE_VIEW("update_view"),
    PUBLISH("publish"),
    COMPLETE("complete")
}

public void recordStageTiming(PipelineStage stage, Instant start) {
    Timer.builder("eventsourcing.pipeline.stage.duration")
        .tag("domain", domainName)
        .tag("stage", stage.getLabel())
        .publishPercentiles(0.5, 0.95, 0.99)
        .register(registry)
        .record(Duration.between(start, Instant.now()));
}
Saga Metrics
SagaMetrics tracks the lifecycle of distributed sagas:
public class SagaMetrics {

    private static final String PREFIX = "saga";

    // Lifecycle counters (tagged by sagaType)
    "saga.started"               // Sagas initiated
    "saga.completed"             // Sagas completed successfully
    "saga.compensated"           // Sagas that required compensation
    "saga.failed"                // Sagas that failed
    "saga.timedout"              // Sagas that exceeded their deadline

    // Step-level counters
    "saga.steps.completed"       // Individual steps completed
    "saga.steps.failed"          // Individual steps failed
    "saga.compensation.started"  // Compensation processes initiated
    "saga.compensation.steps"    // Compensation steps executed

    // Duration timers (p50, p95, p99)
    "saga.duration"              // End-to-end saga duration
    "saga.compensation.duration" // Compensation duration
}
Beyond the Core
Pipeline and saga metrics tell you how events flow and how transactions coordinate. But a production system has more to watch. The framework instruments several additional subsystems:
The outbox pattern guarantees at-least-once delivery to the shared cluster. Metrics track entries written, claimed, delivered, and failed. If outbox.entries.written is climbing faster than outbox.entries.delivered, your delivery pipeline is falling behind.
Events that fail delivery repeatedly land in the DLQ. Three counters — dlq.entries.added, dlq.entries.replayed, dlq.entries.discarded — tell you whether poison messages are accumulating or getting resolved.
When PostgreSQL persistence is enabled, write/read latency, batch sizes, and error counts are tracked per map. High persistence.store.duration points to database bottlenecks.
The idempotency guard tracks duplicate detection tagged hit (duplicate blocked) or miss (new event). A high hit ratio under normal operation is actually good news — it means at-least-once delivery is working and duplicates are being caught.
Circuit breaker state, failure rates, and retry outcomes from Resilience4j are exposed automatically. When resilience4j_circuitbreaker_state flips to OPEN, a downstream service is in trouble.
And then there are business metrics — revenue, order item counts, customer totals, inventory replenishment. These are the ones business stakeholders actually care about. They bridge the gap between “pipeline is fast” and “orders are generating revenue.”
The complete catalog of every metric name, tag, Prometheus mapping, and troubleshooting guide is in the Metrics Reference Guide.
Caching Metric Instances
At 100,000+ events per second, looking up a Counter in Micrometer’s registry on every event is measurable overhead. SagaMetrics caches metric instances in a ConcurrentHashMap:
private final ConcurrentMap<String, Counter> counterCache;
private final ConcurrentMap<String, Timer> timerCache;

private Counter getCounter(String name, String sagaType) {
    String key = name + ":" + sagaType;
    return counterCache.computeIfAbsent(key, k ->
            Counter.builder(PREFIX + "." + name)
                    .tag("sagaType", sagaType)
                    .register(meterRegistry)
    );
}
Small detail, but at high throughput every nanosecond in the hot path matters.
JVM and System Metrics
Beyond application metrics, the framework auto-registers JVM metrics via MetricsConfig:
@Configuration
public class MetricsConfig {

    @Bean public JvmMemoryMetrics jvmMemoryMetrics()   { return new JvmMemoryMetrics(); }
    @Bean public JvmGcMetrics jvmGcMetrics()           { return new JvmGcMetrics(); }
    @Bean public JvmThreadMetrics jvmThreadMetrics()    { return new JvmThreadMetrics(); }
    @Bean public ClassLoaderMetrics classLoaderMetrics() { return new ClassLoaderMetrics(); }
    @Bean public ProcessorMetrics processorMetrics()    { return new ProcessorMetrics(); }
}
Common tags applied to every metric enable cross-service filtering:
registry.config().commonTags(Arrays.asList(
    Tag.of("application", applicationName),
    Tag.of("version", applicationVersion)
));
Every metric — JVM heap usage, saga completion rates, business revenue — can be filtered by service name in Grafana.
Configuring Prometheus
Service-Side: Spring Boot Actuator
Each service exposes metrics via Actuator with Prometheus export:
# application.yml
management:
  endpoints:
    web:
      exposure:
        include: health,prometheus,metrics,info
  endpoint:
    health:
      show-details: always
  metrics:
    export:
      prometheus:
        enabled: true
    tags:
      application: ${spring.application.name}
This creates the /actuator/prometheus endpoint that Prometheus scrapes.
Prometheus-Side: Scrape Configuration
Prometheus scrapes all four services and the Hazelcast cluster:
# docker/prometheus/prometheus.yml
global:
  scrape_interval: 15s
  evaluation_interval: 15s
  external_labels:
    monitor: 'ecommerce-demo'

scrape_configs:
  - job_name: 'account-service'
    metrics_path: '/actuator/prometheus'
    static_configs:
      - targets: ['account-service:8081']

  - job_name: 'inventory-service'
    metrics_path: '/actuator/prometheus'
    static_configs:
      - targets: ['inventory-service:8082']

  - job_name: 'order-service'
    metrics_path: '/actuator/prometheus'
    static_configs:
      - targets: ['order-service:8083']

  - job_name: 'payment-service'
    metrics_path: '/actuator/prometheus'
    static_configs:
      - targets: ['payment-service:8084']

  - job_name: 'hazelcast'
    metrics_path: '/hazelcast/rest/cluster'
    static_configs:
      - targets:
          - 'hazelcast-1:5701'
          - 'hazelcast-2:5701'
          - 'hazelcast-3:5701'
Each service gets its own job, so Prometheus labels metrics with job=”account-service” etc. automatically.
Grafana Dashboards
Dashboard Strategy
Five pre-provisioned dashboards, each focused on a different operational concern:
| Dashboard | Focus | Key Question It Answers |
|---|---|---|
| System Overview | Service health and throughput | “Is everything running? How much traffic?” |
| Event Flow | Pipeline performance | “How fast are events processing? Where are bottlenecks?” |
| Materialized Views | View update performance | “Are views keeping up with events?” |
| Saga Dashboard | Distributed transaction health | “Are sagas completing? Any failures or timeouts?” |
| Business Overview | Revenue, orders, customers | “Is the business healthy? Are orders generating revenue?” |
System Overview is the home dashboard — first thing you see when you open Grafana.
Auto-Provisioning
Dashboards, datasources, and alerts are all provisioned automatically. When Grafana starts, it reads configuration from mounted volumes:
docker/grafana/
├── dashboards/                    # Dashboard JSON files
│   ├── system-overview.json       # Auto-loaded as home dashboard
│   ├── event-flow.json
│   ├── materialized-views.json
│   ├── saga-dashboard.json
│   └── business-overview.json
└── provisioning/
    ├── datasources/
    │   └── datasources.yml        # Points to Prometheus
    ├── dashboards/
    │   └── dashboards.yml         # Tells Grafana where to find JSONs
    └── alerting/
        ├── alerts.yml             # Alert rule definitions
        ├── contactpoints.yml      # Notification channels
        └── policies.yml           # Routing policies
No manual setup. docker-compose up and the dashboards are ready.
Key Dashboard Panels
System Overview
At-a-glance health for the whole system: service health indicators (green/red per service based on up{job=”…”}), event throughput by service, HTTP request rates, pipeline P95 latency, and a saga summary showing started, completed, failed, and timed out counts.
Saga Dashboard
Deep visibility into distributed transactions. Active saga count and compensating count — how many are in flight right now. Throughput charts for start, complete, and compensate rates, filterable by sagaType. Duration percentiles at P50, P95, P99. Success rate as a percentage. Timeout detection rate. Compensation breakdown — are any compensation steps failing?
The dashboard supports a $sagaType variable, so you can filter to just “OrderFulfillment” or “OrderFulfillmentOrchestrated” or view everything at once.
Event Flow
The pipeline performance dashboard: events published per second by service, end-to-end latency percentiles, queue wait latency (are events sitting around before processing starts?), a stacked stage duration breakdown at P95 for persist, update_view, and publish, and failed events by stage and type.
Business Overview
This one bridges technical and business concerns. Cumulative revenue over time, order rate with item counts, customer growth, saga success rate (what percentage of orders complete without compensation?), and end-to-end saga duration.
Alerting
Pre-Configured Alerts
Six alerts that cover the most common failure modes:
Saga Alerts
| Alert | Severity | Condition | For |
|---|---|---|---|
| High Saga Failure Rate | Critical | increase(saga_failed_total[5m]) > 0 | 2 min |
| Saga Timeouts Detected | Warning | increase(saga_timeouts_detected_total[5m]) > 0 | 2 min |
| Saga Compensation Failures | Critical | increase(saga_compensations_failed_total[5m]) > 0 | 1 min |
| Low Saga Success Rate | Warning | Success rate < 90% over 10 minutes | 5 min |
Service Health Alerts
| Alert | Severity | Condition | For |
|---|---|---|---|
| Service Down | Critical | up < 1 for any service | 1 min |
| High Event Processing Error Rate | Warning | Error rate > 5% over 5 minutes | 3 min |
The “For” duration prevents flapping — a brief network blip won’t page you at 3am. Compensation failures fire fastest (1 minute) because a failed compensation means money or inventory is in an inconsistent state.
Distributed Tracing with Jaeger
Metrics tell you that something is slow. Tracing tells you why.
In our system, a single order placement can touch four services: Order creates the order, Inventory reserves stock, Payment processes the charge, Order confirms. With metrics alone, you see “P99 saga duration increased.” With tracing, you see “Payment Service is taking 2 seconds to respond to StockReserved events.” That’s the difference between knowing there’s a problem and knowing where it is.
Configuration
Tracing is enabled via Spring Boot’s OpenTelemetry integration:
management:
  tracing:
    enabled: true
    sampling:
      probability: 1.0   # Sample 100% of requests (reduce in production)
  otlp:
    tracing:
      endpoint: ${OTEL_EXPORTER_OTLP_ENDPOINT:http://localhost:4317}
Jaeger runs as an all-in-one container in the Docker stack, receiving traces via OTLP on port 4317. In the Jaeger UI (http://localhost:16686), you pick a service, find traces for a time window, click into a trace to see the span waterfall across all four services, and identify which operation is contributing to latency.
The most valuable traces in an event-sourced system: the full path from API request to pipeline completion, saga flows (OrderCreated → StockReserved → PaymentProcessed → OrderConfirmed), and compensation flows — where did the failure occur, and how long did compensation take?
Useful PromQL Queries
Queries you can run in Prometheus or use in custom Grafana panels:
Service Health
# Are all services up?
up{job=~".*-service"}

# HTTP request rate by service
sum by (application) (rate(http_server_requests_seconds_count[5m]))
Event Pipeline
# Event throughput
rate(eventsourcing_pipeline_events_processed_total[5m])

# End-to-end P99 latency
histogram_quantile(0.99, rate(eventsourcing_pipeline_latency_end_to_end_seconds_bucket[5m]))

# Queue wait time (events waiting to be processed)
histogram_quantile(0.95, rate(eventsourcing_pipeline_latency_queue_wait_seconds_bucket[5m]))
Sagas
# Saga completion rate
rate(saga_completed_total[5m])

# Saga success rate (percentage)
sum(saga_completed_total) /
  (sum(saga_completed_total) + sum(saga_compensated_total) +
   sum(saga_failed_total) + sum(saga_timedout_total))

# Saga duration P99
histogram_quantile(0.99, rate(saga_duration_seconds_bucket[5m]))

# Active timeouts in last 5 minutes
increase(saga_timeouts_detected_total[5m])
Business
# Cumulative revenue
order_revenue_total

# Orders per second
rate(order_items_count_total[5m])

# Current customer count
account_customers_total
JVM
# Heap memory usage
jvm_memory_used_bytes{area="heap"}

# GC pause time
rate(jvm_gc_pause_seconds_sum[5m])
Lessons Learned
Don’t just measure HTTP latency. In an event-sourced system, the interesting latency is inside the pipeline — from event submission to view update. HTTP latency includes that but hides where the time is spent.
Multi-dimensional tags (domain, eventType, sagaType, stage) are not optional. A P99 spike in “pipeline latency” is useless without knowing which domain and stage are affected.
Cache your Counter and Timer instances at high throughput. Registry lookups add up. ConcurrentHashMap.computeIfAbsent works well.
Provision everything as code. Don’t create dashboards by hand — provision them from JSON files. Your observability stack is version-controlled, reproducible, and deploys automatically. When someone clones the repo and runs docker-compose up, they get the same dashboards as everyone else.
Alert on business outcomes, not just infrastructure. “Service Down” is an infrastructure alert. “Saga Failure Rate” is a business outcome alert. Both matter, but the business alerts catch problems that don’t manifest as service crashes — like a payment gateway returning errors, causing saga compensations to spike while all four services stay green.
The framework provides roughly 70 metrics organized into a dozen categories — pipeline throughput and per-stage latency, saga lifecycle tracking, outbox delivery, dead letter queues, persistence latency, circuit breaker state, business KPIs, JVM health, HTTP request rates. Combined with auto-provisioned Grafana dashboards, pre-configured alerts, and distributed tracing via Jaeger, you get complete visibility into a system where a single API call can trigger asynchronous processing across four services.
Event sourcing makes observability both harder and more important. Events are asynchronous, distributed, and flow through multiple stages. Without good metrics and dashboards, you’re flying blind. The Metrics Reference Guide has the complete catalog.
Previous: Hazelcast Write-Behind MapStore: Durable Event Sourcing


Leave a comment